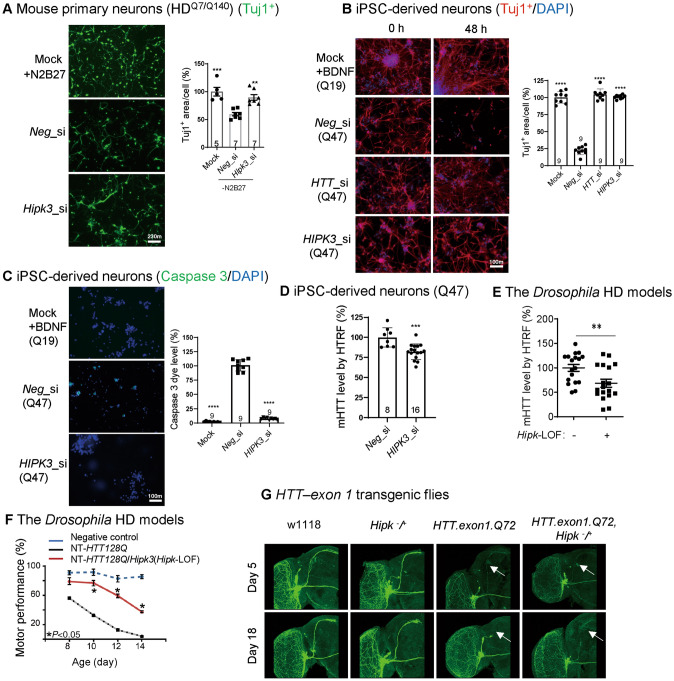
Fig. 1.
The potential pathological role of HIPK3 in HD. A Representative images and quantification of the Tuj1+ area in mouse primary neurons (HDQ7/Q140). Data are normalized to controls with N2 and B27. Note that the mock group was the same for both the Fig. 1A and Fig. 2E quantification (scale bar, 10 µm; n, number of mice of each genotype). B Representative immunostaining results of the neuron-specific tubulin marker Tuj1 and DAPI showing the morphology of human iPSC-derived neurons (HD: polyQ = 47; WT: polyQ = 19). Note that the mock group was the same for both the Fig. 1B and Fig. 2F quantification [scale bar, 10 µm; data are normalized to the wild-type (WT)]. C Representative images and quantification of the caspase signal in human iPSC-derived neurons (HD: polyQ = 47; WT: polyQ = 19), note that the mock group was the same for both the Fig. 1C and Fig. 2G quantification, scale bar, 10 µm. D mHTT levels in HD iPSC-derived neurons (HD: polyQ = 47) treated with HIPK3 RNAi and controls assessed by the pair of antibodies 2B7/3B5H10 using HTRF (homogeneous time-resolved fluorescence). E mHTT levels in fly heads assessed by 2B7/3B5H10 using HTRF (fly model: NT-HTT128Q). F Hipk3 depletion rescues the climbing deficit in HD flies. G Neurodegeneration in axons of small ventral lateral clock neurons (sLNv) labeled by mCD8GFP protein using GMR61G12-GAL4 in a fly model. Mock, N2 and B27 were not removed from the medium for mouse primary neuron culture, BDNF was not removed from the medium for iPSC-derived neuron culture. Neg_si, siScramble; Hipk3_si, siHipk3. Data are presented as the mean ± SD. *P < 0.05; **P < 0.01; ***P < 0.001; ns, P > 0.05; one-way ANOVA and post hoc Dunnett’s tests (A–C, F), and unpaired t-test (D, E).

