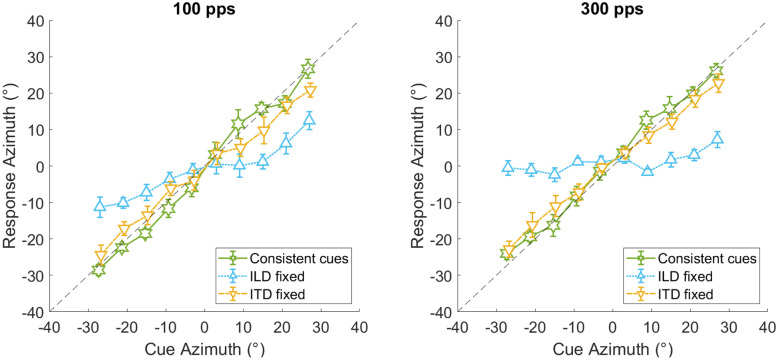
Fig. 5.
Mean response azimuths for varying ITDs (ILDs fixed at ± 3°), varying ILDs (ITDs fixed at ± 3°) and for consistent cues after averaging across all 3 test phases. Results for the 100-pps condition are shown on the left and results for the 300-pps condition are shown on the right. Error bars show the standard error of the mean. Note that varying ITDs and ILDs correspond to the parameters ΔITD and ΔILD, respectively, in the regression analysis (Eq. 2)

