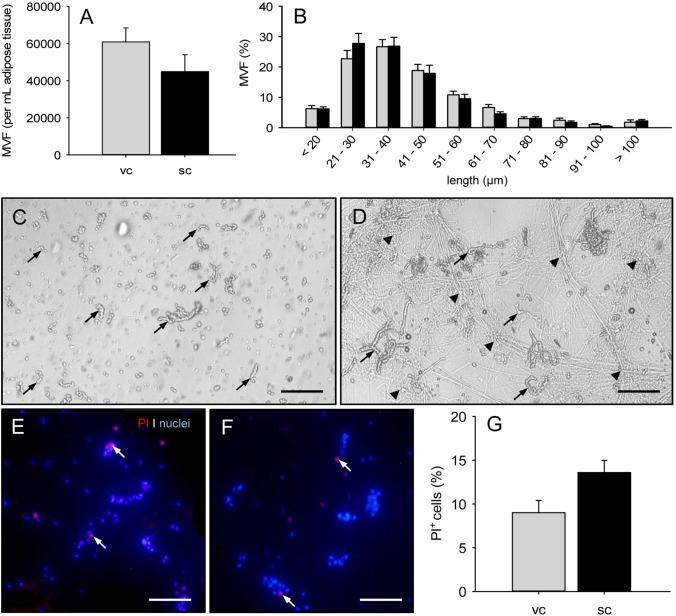
Fig. 3.
Characterization of MVF after enzymatic digestion of murine adipose tissue with collagenase NB 4 Standard Grade. A, B Number (A, given per mL adipose tissue) and length distribution (B, given in %) of MVF isolated from visceral (vc, gray bars, n = 3) and subcutaneous (sc, black bars, n = 3) adipose tissue of donor mice. Means ± SEM. C, D Light microscopic images of MVF isolates from visceral (C) and subcutaneous (D) adipose tissue (arrows = MVF; arrowheads = aggregates of undigested connective tissue fibers). Scale bars: 150 µm. E, F Fluorescence microscopic images of PI-stained MVF from visceral (E) and subcutaneous (F) adipose tissue of donor mice for the assessment of cell viability (arrows = dead PI+ cells). Cell nuclei were stained with Hoechst 33342. Scale bars: 65 μm. G PI+ cells (given in % of all counted cells) of MVF from visceral (vc, gray bar, n = 8) and subcutaneous (sc, black bar, n = 8) adipose tissue of donor mice. Means ± SEM

