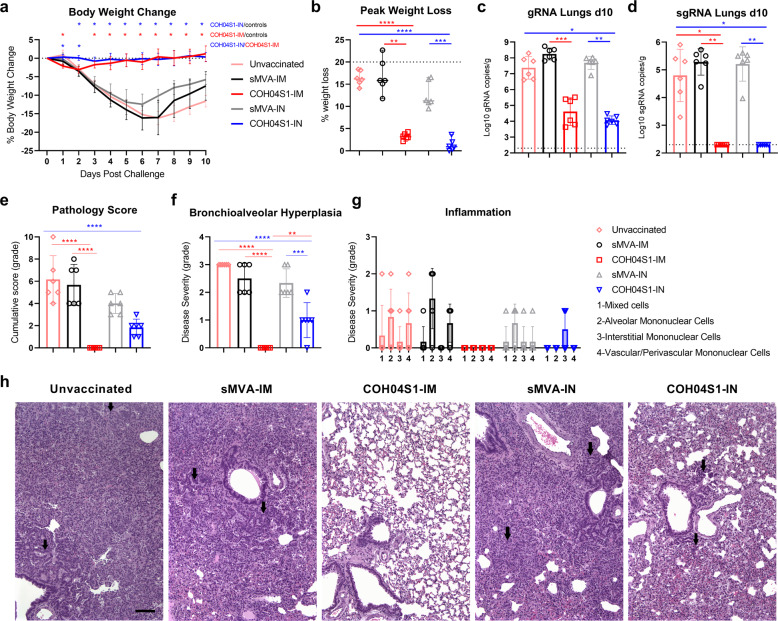
Fig. 2. COH04S1-mediated vaccine protection in hamsters following sub-lethal SARS-CoV-2 challenge. a. Body weight change.
Body weight of COH04S1-IM and COH04S1-IN-vaccinated animals and unvaccinated and sMVA-IM and sMVA-IN vector control animals was measured daily for 10 days post-challenge. Weight loss is reported as mean ± s.d. Two-way ANOVA followed by Tukey’s multiple comparison test was used to compare group mean values at each timepoint. b Maximal weight loss. Percentage of maximal weight loss is shown in single animals of vaccine and control groups. Lines and bars represent median values and 95% CI, respectively. Dotted line represents the maximum weight loss allowed before euthanasia. Peaks of weight loss in each group were compared using one-way ANOVA followed by Tukey’s multiple comparison test. c–d Lung viral loads. SARS-CoV-2 genomic RNA (gRNA) and sub-genomic RNA (sgRNA) copies were quantified in lung tissue of vaccine and control groups at day 10 post-challenge by qPCR. Bars show RNA copies geometric mean ± geometric s.d. Dotted lines represent lower limit of detection. Kruskal–Wallis test followed by Dunn’s multiple comparison test was used. e–h Histopathological findings. Hematoxylin/eosin-stained lung sections of COH04S1-vaccinated hamsters and control animals at day 10 post challenge were evaluated by a board-certified pathologist and microscopic findings were graded based on severity on a scale from 1 to 5 (Supplementary Table 2). Panel e shows the cumulative pathology score of all histopathologic findings in each group. Panel f shows grading of bronchioalveolar hyperplasia disease severity in each group. One-way ANOVA followed by Holm-Sidak’s multiple comparison test was used in e and f. Panel g shows the severity of lung inflammatory microscopic findings based on 1-to-5 scaling of four inflammation types as indicated. One-way ANOVA followed by Tukey’s multiple comparison test was used. Bars in e–g represent mean values ± s.d. *0.05 < p < 0.01, **0.01 < p < 0.001, ***0.001 < p < 0.0001, ****p < 0.0001. Panel h shows representative images of histopathological findings in lung sections of COH04S1-vaccinated animals and control animals. Black arrows indicate moderate and mild bronchioalveolar hyperplasia in lung sections of sMVA-IM and sMVA-IN vector control animals as well as COH04S1-IN-vaccinated animals. Black arrows in lung sections of unvaccinated control animals indicate hyperplastic alveolar cells. 10x magnification. Scale bar = 100 µm.

