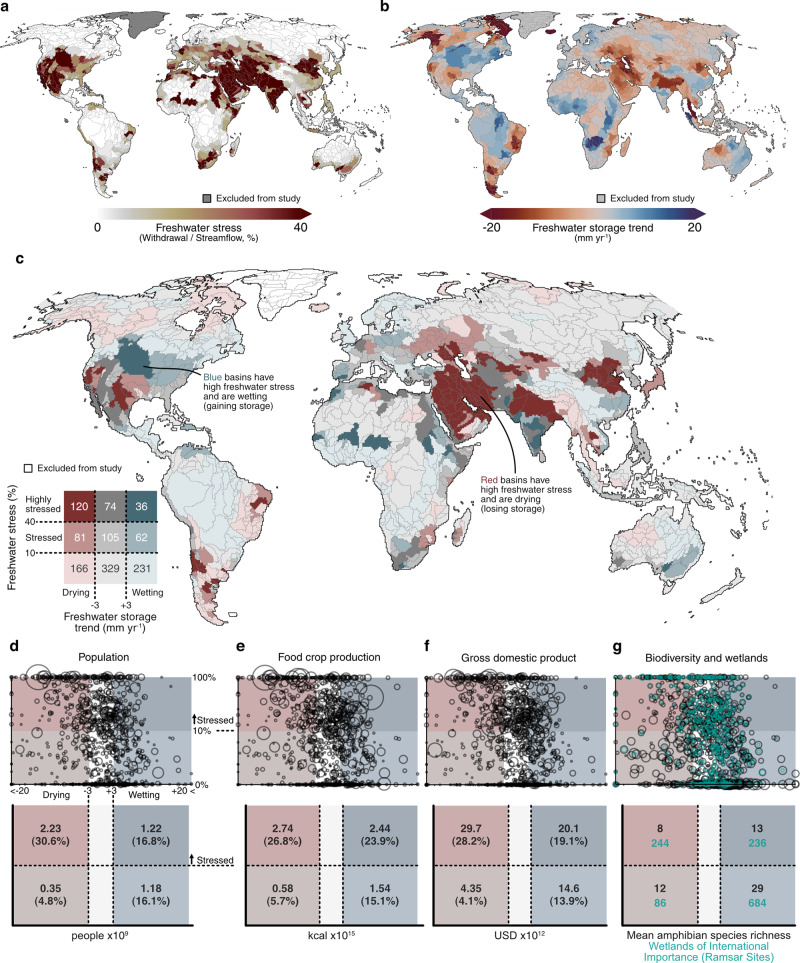
Fig. 1. Global co-occurrence of freshwater stress and storage trends.
a Freshwater stress, derived from freshwater withdrawal and streamflow datasets (see “Methods” section). b Freshwater storage trend per basin. c Combinations of freshwater stress and storage trend per basin, which together derive basin freshwater status (shown in Fig. 2b). Values overlaying the legend indicate the number of basins satisfying each set of conditions. For categorical plotting purposes only, ±3 mm year−1 is used as the threshold denoting a clear directional storage trend, based on the error level of the underlying observations25. d–g The exposure of social-ecological activity to freshwater stress and storage trends. Each plot represents storage trends as the x-axis coordinate, and log-transformed freshwater stress as the y-axis coordinate with the size of each circle based on the basin’s value respective to each plotting dimension.

