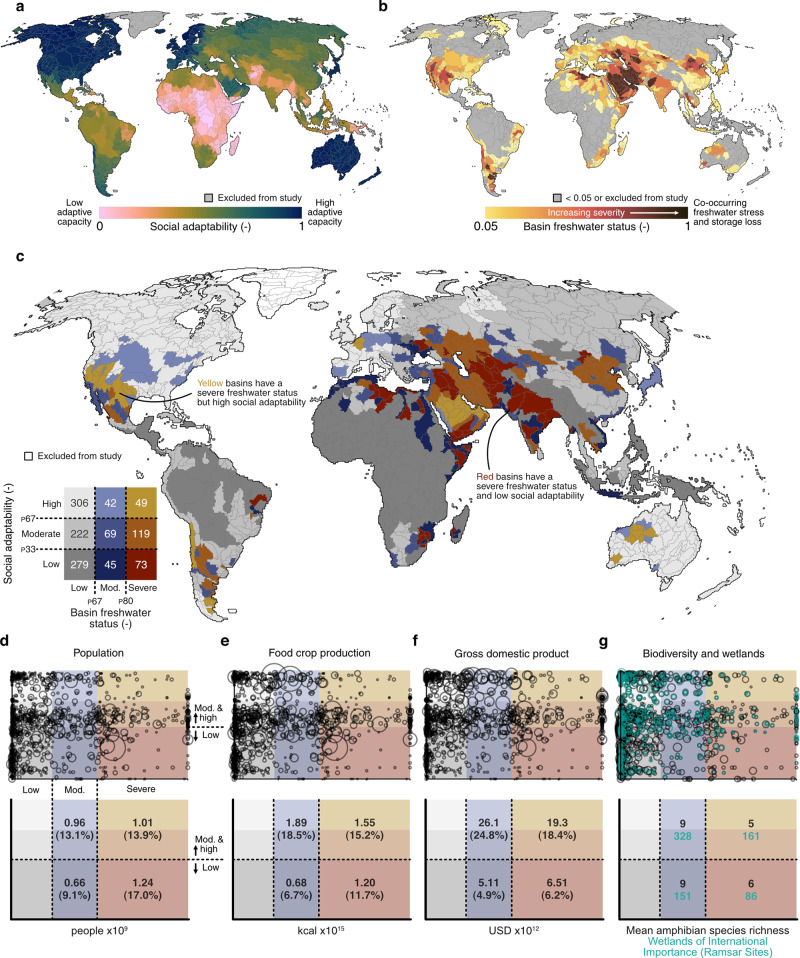
Fig. 2. The relationship between basin freshwater status and social adaptive capacity.
a Social adaptive capacity, or adaptability, per basin. b Basin freshwater status, representing the combination of freshwater stress and storage trend per basin (see “Methods” section). c Combinations of basin freshwater status and social adaptability. Values overlaying the legend indicate the number of basins satisfying each set of conditions. d–g The exposure of social-ecological activity to basin freshwater status (x-axis coordinate) and social adaptive capacity (y-axis coordinate), with the size of each circle scaled based on the basin’s value respective to each plotting dimension. These distributions are summarized below each plot. P notation represents the percentile distribution.

