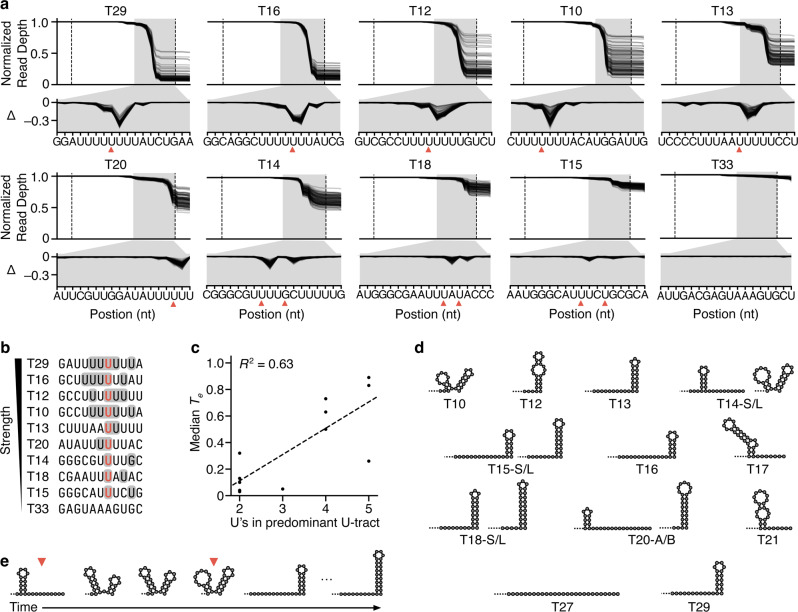
Fig. 2. Nucleotide resolution read depth profiles reveal terminator phenotypes.
a Normalized dRNA-seq read depth profiles for functioning terminators and non-terminator control (T33). Each line corresponds to a design. Dotted lines denote the start and end of the core terminator. Red triangle indicates the final nucleotide of the dominant point(s) of termination. The gray-shaded region is expanded in the lower panel showing the change in normalized read depth at each nucleotide position with respect to the previous nucleotide (Δ). b Termination locations for functioning terminators. Many terminators terminate at more than one position and these points are indicated with shading. The most common point of termination is colored red. c Median termination efficiency (Te) for designs containing each core terminator compared to the number of U residues in the U-tract, which is the 8 nt sequence upstream of the point of termination. R2 is the square of the Pearson correlation coefficient. d Secondary structure predictions of transcripts using a co-transcriptional folding simulation at the measured point of termination for each terminator (for inactive terminators, the sequence downstream of the hairpin with a maximal number of U residues was used). Two structures are shown for T20; T20-A is formed first, and T20-B lies over a large energy threshold. For weak terminators, the structure prediction for both the shorter (S) and the longer (L) transcripts produced are shown. e Co-transcriptional RNA secondary structures predicted for T14 as it is transcribed, with dominant points of termination indicated. Source data are provided as a Source Data file.

