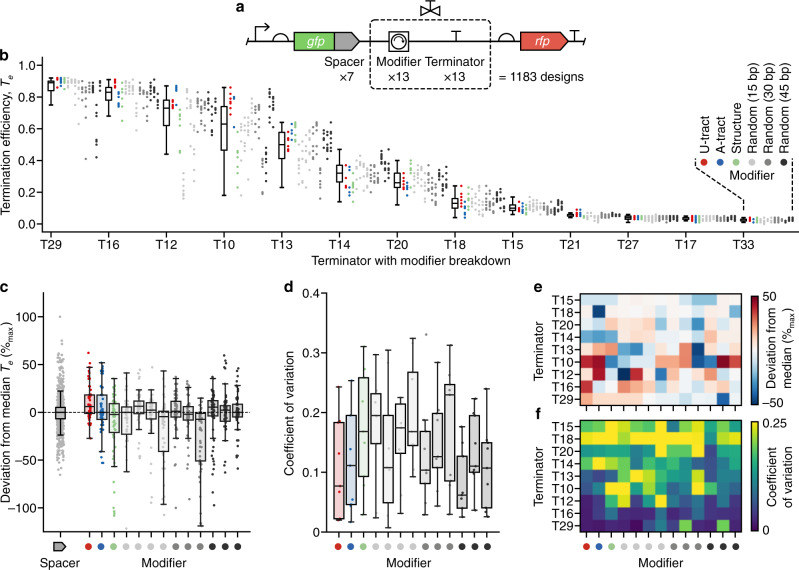
Fig. 3. Characterization of a T7 RNA polymerase transcriptional valve library.
a Structure of the transcriptional valve library. Gray ‘spacer’ elements fused to gfp are 33 bp random sequences used to assess the sensitivity of a transcriptional valve to nearby sequence context (full sequences available in Supplementary Data 1). b Termination efficiency (Te) for designs in the library (Supplementary Data 2). Each point denotes the Te value for a unique genetic construct color-coded by the modifier present. Points are grouped by core terminator with a box plot summarizing the data for all associated constructs. n = 91 for each core terminator, apart from T13 where n = 90 and T18 where n = 89. c Percentage deviation in Te (as a percentage of maximum possible deviation) for each construct from the median of all constructs containing the same core terminator. Each point corresponds to a single construct and points are grouped by modifier. Only data for active terminators (median Te > 0.05; T29, T16, T12, T10, T13, T14, T20, T18, T15) are shown. n = 819 for spacers and n = 63 for all modifiers, apart from M14 where n = 60. d Coefficient of variation (CV) of Te values across spacer variants for active terminators grouped by modifier. n = 9 for each modifier. e Terminator and modifier breakdown of the CV of Te values across spacer variants for active terminators. f Terminator and modifier breakdown of the percentage deviation in Te (as a percentage of maximum possible deviation) for active terminators. Random sequence modifier parts in all plots: (left–right) M10–M22. All box plots show the median as their center value, the bounds of the box are the interquartile range (IQR; 25–75%), and whiskers are from Q1 – 1.5 × IQR to Q3 + 1.5 × IQR, where Q1 and Q3 are the 25% and 75% quartile, respectively. Source data are provided as a Source Data file.

