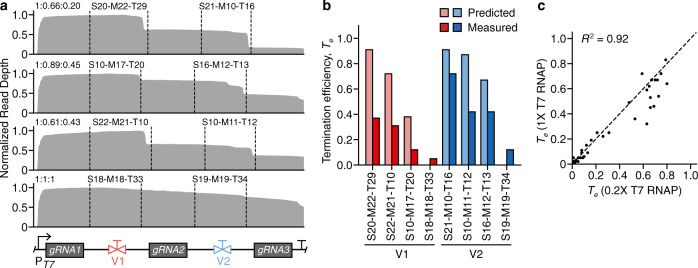
Fig. 6. Using transcriptional valves to regulate an array of CRISPR sgRNAs.
a Normalized dRNA-seq read depth profile for each array. Dotted lines denote the start and end of each valve. General array design is shown at the bottom, with the PT7 promoter followed by 3 guide RNAs (gRNAs) separated by two transcriptional valves (V1, V2). Resulting gRNA stoichiometries are indicated in top left of each profile (gRNA1:gRNA2:gRNA3) and valve designs are shown above their respective parts. b Comparison of predicted (lighter shading) and measured (darker shading) termination efficiency (Te) for each valve in the arrays. Bars are colored by valve position. c Comparison of Te measurements for in vitro transcription reactions performed with varying concentrations of T7 RNA polymerase (RNAP). Each point corresponds to a transcriptional valve. R2 is the square of the Pearson correlation coefficient. Source data are provided as a Source Data file.

