Fig. 1.
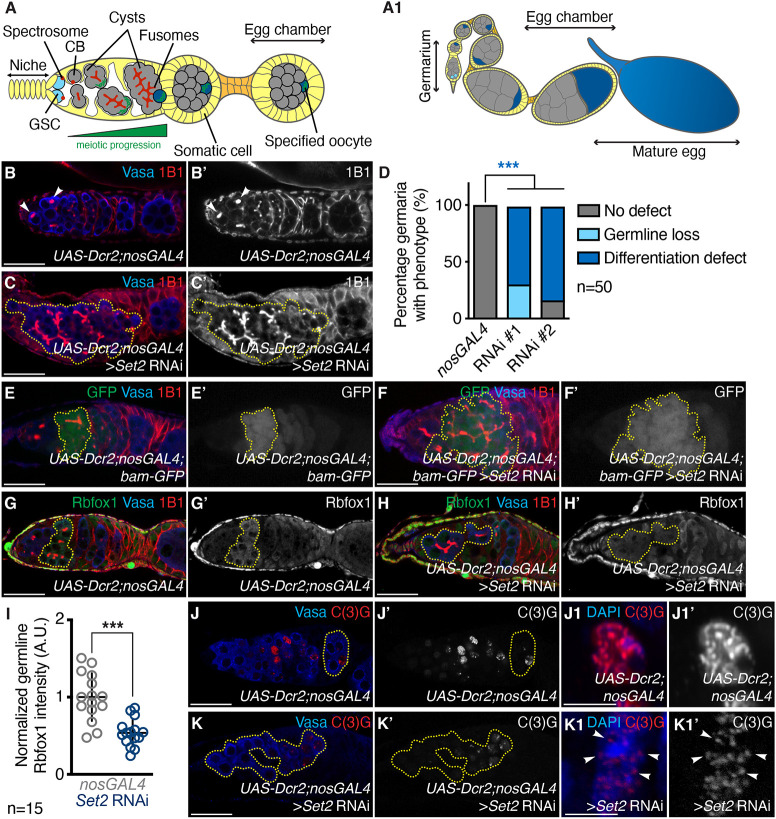
Set2 is required in the germline for differentiation during oogenesis. (A) Schematic of a Drosophila germarium where germ cells (gray, and light and dark blue) are surrounded by somatic cells (yellow). Germ cells differentiate and specify an oocyte (green/blue). (A1) A schematic of a Drosophila ovariole showing egg chambers that house a maturing oocyte (blue) connected by somatic cells (orange). (B,B′) Control and (C,C′) germline-depleted Set2 (RNAi line #1) germaria stained for Vasa (blue) and 1B1 (red) show that Set2 germline depletion results in differentiation defects such as accumulation of irregular cysts with >16 cells (yellow dashed outline), accumulation of 16-cell cysts close to the niche and loss of GSCs (white arrowheads in control). The 1B1 channel is shown in B′ and C′. (D) Quantitation of B-C′. Data are percentage of germaria. Fisher's exact test; ***P<0.001. (E,E′) Control and (F,F′) germline-depleted Set2 germaria both carrying a bam-GFP transgene stained for GFP (green), Vasa (blue) and 1B1 (red) show that Set2 germline depletion results in irregular GFP-positive cysts compared with control (yellow dashed outline) (90% in Set2 RNAi compared with 4% in nosGAL4; P<2.2E-16, n=50, Fisher's exact test). GFP channel is shown in E′ and F′. (G,G′) Control and (H,H′) germline-depleted Set2 germaria stained for Rbfox1 (green), Vasa (blue) and 1B1 (red) show that Set2 germline depletion results in decreased levels of Rbfox1 in the germline compared with control (yellow dashed outline). Rbfox1 channel is shown in G′ and H′. (I) Quantitation of G-H′, Student t-test; ***P<0.001. (J-J1′) Control and (K-K1′) germline-depleted Set2 germaria stained for Vasa (blue) and C(3)G (red) show that Set2 germline depletion results in aberrant C(3)G staining compared with control (yellow dashed outline) (100% in Set2 RNAi compared with 2% in nosGAL4; P<2.2E-16, n=50) and improper assembly of the synaptonemal complex (white arrowheads). Statistical analysis, Fisher's exact test. Data are mean±95% CI. C(3)G channel is shown in J′, J1′, K′ and K1′. Scale bars: 20 μm for B-C′,E-H′,J,J′,K,K′; 2 μm for J1,J1′,K1,K1′.

