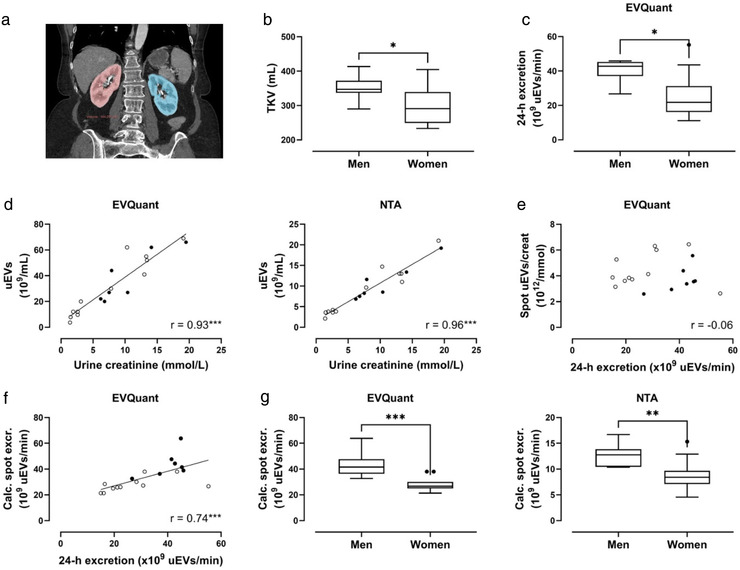
FIGURE 1.

Total kidney volume and urinary extracellular vesicle (uEV) excretion in males and females. (a) Example of total kidney volume determination by segmentation in a computed tomography (CT) image of the kidneys (right kidney red, left kidney blue); (b) Comparison of total kidney volume (TKV) between men and women; (c) uEV excretion in men versus women measured by EVQuant in 24‐h urine; (d) Pearson correlations of urine creatinine versus uEV concentration in men (●) and women (○), measured by EVQuant (left panel) and nanoparticle tracking analysis (NTA, right panel); (e) Spearman correlation of 24‐h uEV excretion versus spot uEV/creatinine measured by EVQuant; (f) Spearman correlation of 24‐h uEV excretion versus calculated spot uEV excretion (spot uEV/creatinine * 24‐h urine creatinine) measured by EVQuant; (g) Calculated spot uEV excretion in men versus women measured by EVQuant (left panel) and NTA (right panel). Box plots are Tukey plots. Men are represented by ● and women by ○; *p ≤ 0.05, **p < 0.01, ***p < 0.001
