FIGURE 4.

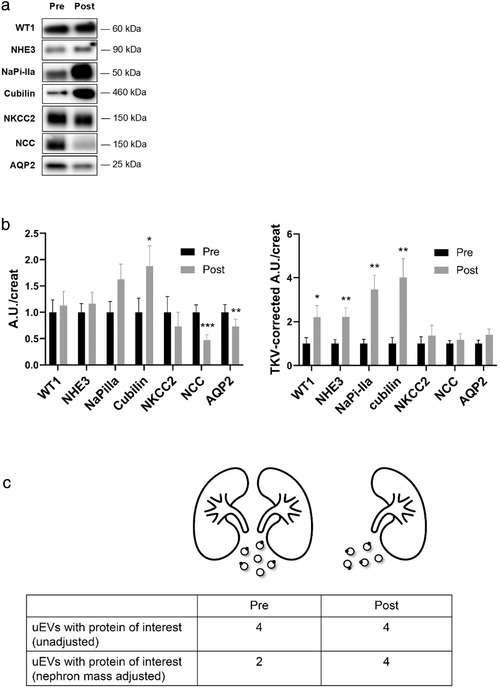
Changes in urinary extracellular vesicle (uEV) nephron marker proteins after donor nephrectomy. (a) Representative immunoblots before and after donor nephrectomy of nephron marker proteins in uEVs isolated from spot urine, including the podocyte marker Wilm's tumour 1 (WT1), the proximal tubule markers sodium‐hydrogen exchanger 3 (NHE3), sodium/phosphate co‐transporter IIa (NaPi‐IIa), and cubilin, the loop of Henle marker sodium‐potassium‐chloride co‐transporter 2 (NKCC2), the distal convoluted tubule marker sodium‐chloride cotransporter (NCC), and the collecting duct marker aquaporin‐2 (AQP2). All proteins were loaded relative to urine creatinine; (b) Densitometry of absolute changes in uEV protein abundances before (Pre) and after (Post) donor nephrectomy (n = 19; A.U., arbitrary units). Densitometry of uEV protein abundances relative to total kidney volume (TKV‐corrected A.U./creat) before (Pre) and after (Post) donor nephrectomy; c) Cartoon illustrating the changes in uEV and uEV biomarker excretion before (Pre) and after (Post) donor nephrectomy. Donor nephrectomy reduces the overall uEV excretion rate by ∼19% (6 to 5 uEVs in the cartoon). In the example, four out of six uEVs contain an uEV biomarker of interest before donor nephrectomy and four out of five uEVs after donor nephrectomy. This illustrates the need to normalize by kidney volume otherwise the doubling in uEV biomarker would remain undetected. This example illustrates the observations for WT1 and NHE3 (no change when not adjusting for total kidney volume versus two‐fold increase when adjusting for total kidney volume, Figure 4B). *p ≤ 0.05, **p < 0.01, ***p < 0.001
