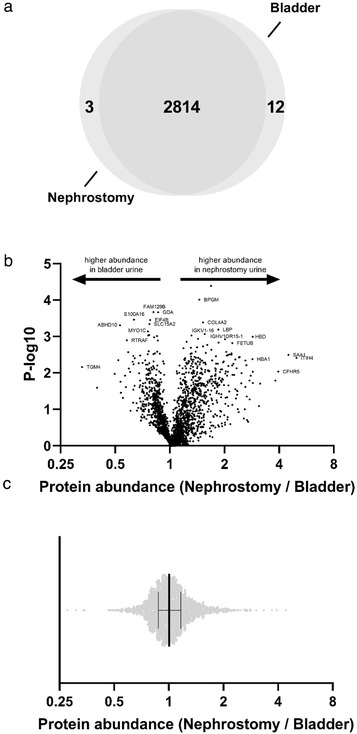
FIGURE 5.

Comparison of the number and abundance of uEV proteins from nephrostomy or bladder urine. (a) In nine patients with a nephrostomy drain urine samples for uEV analysis were collected from both the nephrostomy drain and normal micturition (“bladder,” see also Table S3 and S4 ). Mass spectrometry identified 2829 proteins of which 2814 were identified in uEVs isolated from the nephrostomy drain and bladder urines and 3 and 12 proteins were only identified in the nephrostomy and bladder urine samples, respectively. (b) A Vulcano plot is shown for the 2462 proteins for which the abundance could be determined indicating whether protein abundance was higher in the bladder or nephrostomy urine sample. (c) The distribution of the nephrostomy/bladder uEV protein abundance ratios is shown illustrating that the abundance of the majority of the uEV proteins was similar in both sources (nephrostomy/bladder uEV protein abundance ratio 1.0, IQR 0.9–1.2)
