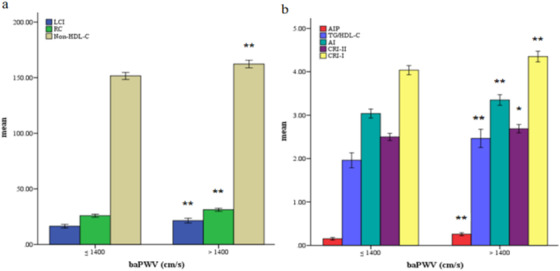
FIGURE 1.

Bar graph of mean value of variables stratified by brachial‐ankle pulse wave velocity (baPWV). ** Compared with non‐AS group, participants in AS group had significantly higher LCI, RC, Non‐HDL‐C, CRII, AIP, TG/HDL‐C and AI (p < .001). * Compared with non‐AS group, participants in AS group had significantly higher CRI‐II (p < .01). Abbreviations: AS, arterial stiffness; RC, remnant cholesterol; AIP, atherogenic index of plasma; LCI, lipoprotein combine index; AI, atherosclerosis index; TG, triglycerides; HDL‐C, high‐density lipoprotein cholesterol; CRI‐I, Castelli's risk index I; CRI‐II, Castelli's risk index II
