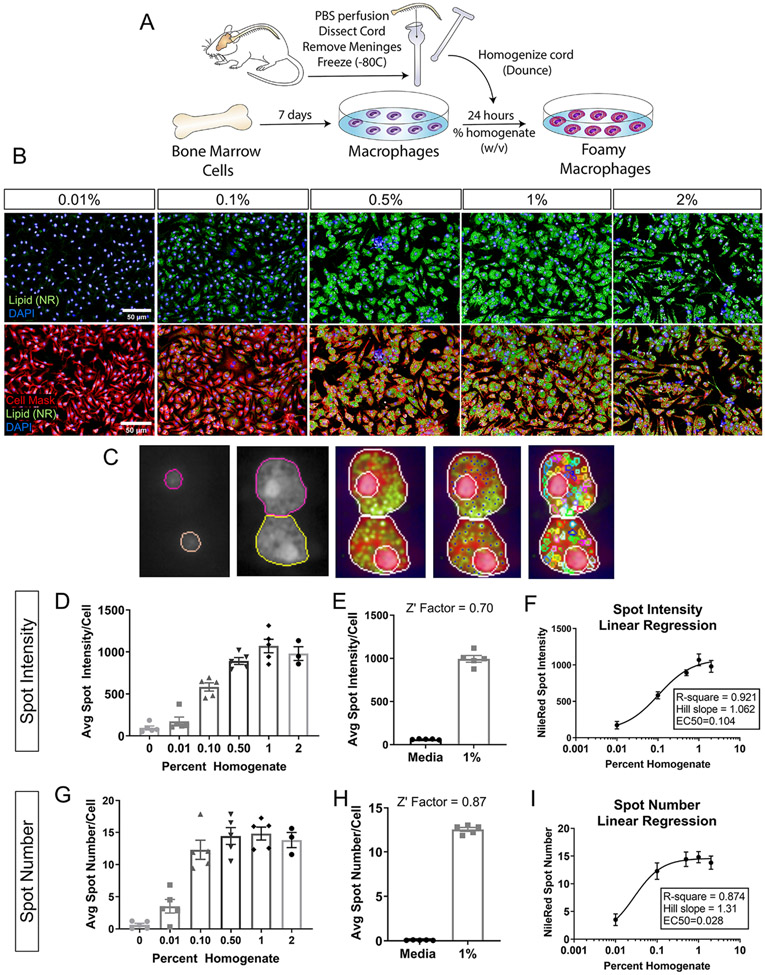
Figure 1. Foamy macrophage assay development and optimization.
(A) Schematic of foamy macrophage assay workflow. (B) Representative images of foamy macrophages treated with wildtype spinal cord homogenate at 0.01, 0.1, 0.5,1.0, and 2.0% (w/v, weight/volume). Neutral lipid droplets stained with Nile Red (green), nuclei with DAPI (blue), cell membrane with Cell Mask (pseudo-colored red) (Scale bar 50 μm). (C) Examples of nuclei and cell segmentation, and lipid droplet identification used in the phenotypic analyses. (D) Dose response for lipid droplet fluorescence intensity in macrophages treated with 0.01, 0.1, 0.5,1.0, and 2.0% homogenate (w/v) (E) Z’ factor calculations between positive (1% homogenate) and negative (media only) controls for lipid droplet intensity. (F) 4-parameter nonlinear regression fit of homogenate dose response curve using lipid droplet intensity. x-axis is expressed in logarithmic form. Goodness of fit assessed by R-square value and linearity of response calculated by Hill’s Slope (1.0=perfectly linear). (G) Dose response for lipid droplet number for macrophages treated with 0.01, 0.1, 0.5,1.0, and 2.0% homogenate (w/v). (H) Z’ factor calculations between positive (1% homogenate) and negative (media only) controls for lipid droplet number. (I) 4-parameter nonlinear regression fit of homogenate dose response curve using lipid droplet number. x-axis is expressed in logarithmic form. (n=5 biological replicates for 0-1%; n=3 for 2% condition; n=5 technical replicates in E, H; error bars=SEM)

