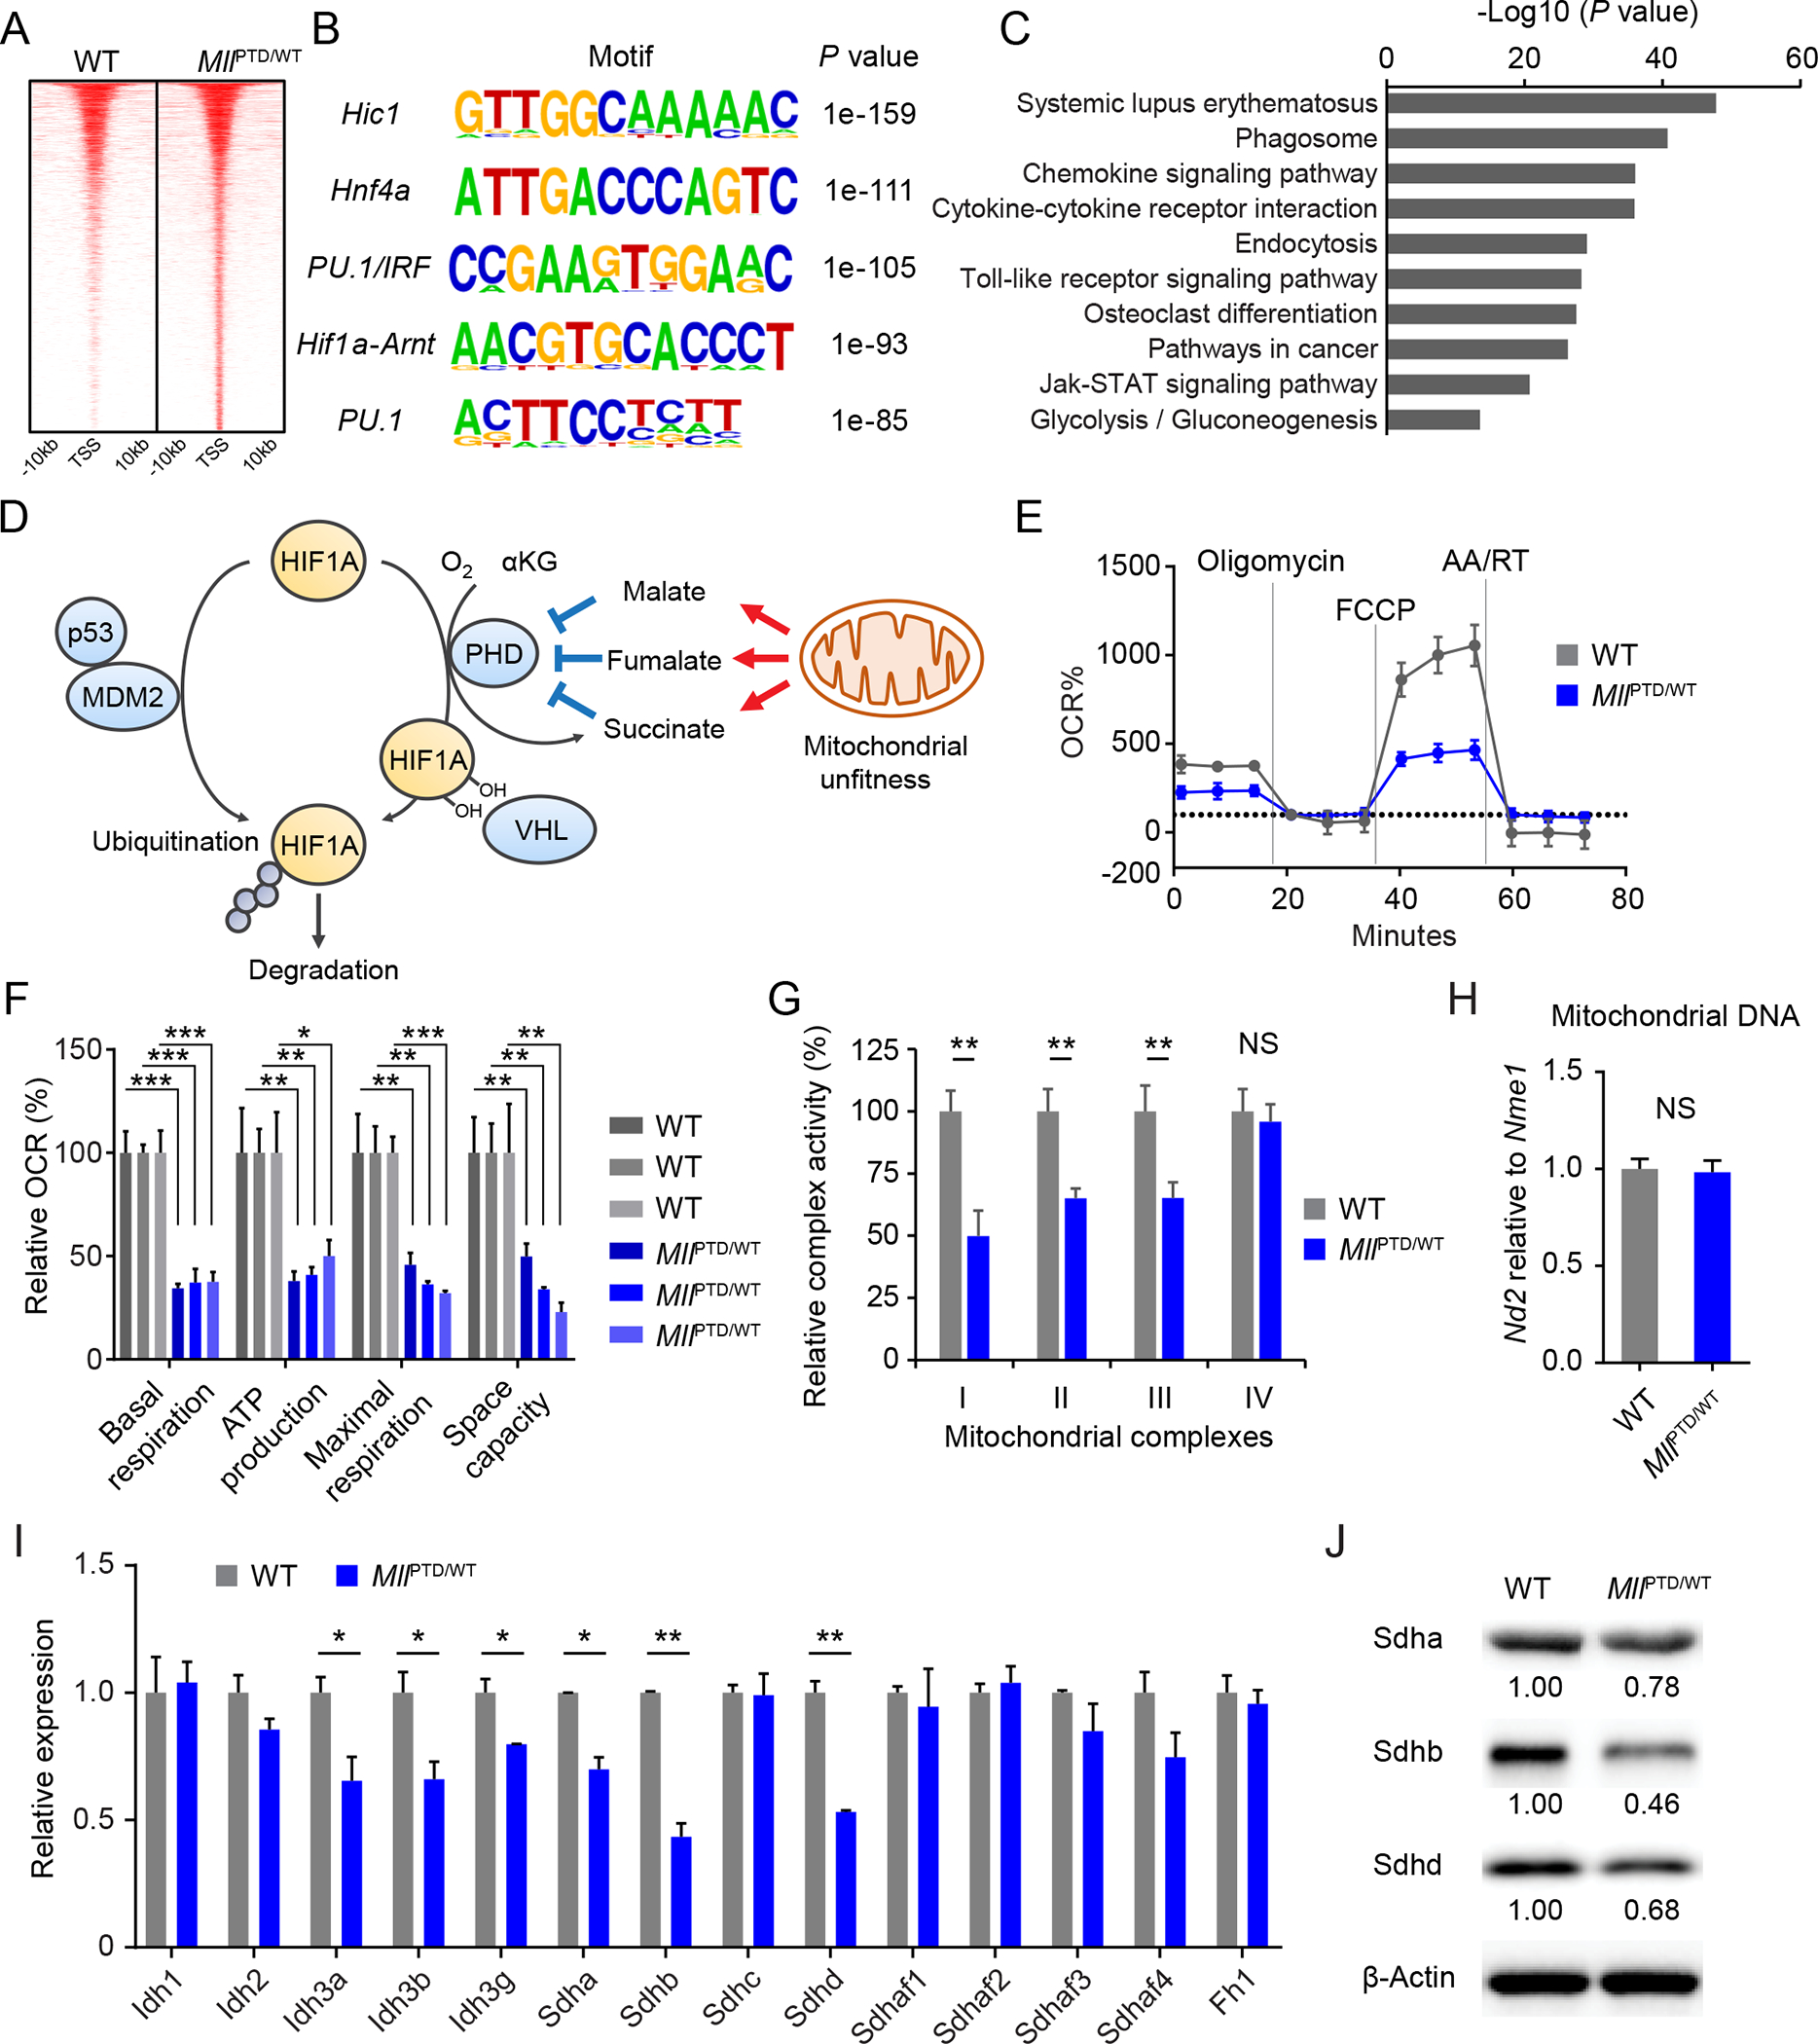
Figure 3. Downregulation of mitochondrial complex II in MLL-PTD.

A, Heatmap showing differentially H3K4me3-marked regions (±10 kb regions from TSS). B, Enriched motifs found in the differentially H3K4me3-marked regions from indicated samples. C, KEGG pathway enrichment analysis on the gene set from the differentially H3K4me3-marked regions in MLL-PTD. False discovery rate (FDR) < 0.001 was used. D, Schematic of HIF1A protein regulation. E-F, Measurements of mitochondrial respiration in c-Kit+ BM cells from indicated mice. Average results are shown (n = 3 per group) in (E). Relative basal respiration, ATP production, maximal respiration, and space capacity are shown in (F). Data are mean ± s.d. G, Mitochondrial complex activity in the c-Kit+ cells from indicated mice. Relative activity is shown (n = 3 per group). Data are mean ± s.d. H, Mitochondrial DNA amount in the c-Kit+ cells from indicated mice. Data are mean ± s.d. I, Expression levels of genes related to TCA cycle enzymes in the c-Kit+ cells from indicated mice. Data are mean ± s.d. Representative plots from more than three independent studies are shown. J, Sdha, Sdhb, and Sdhd protein expression in the c-Kit+ cells from indicated mice. *P < 0.05, **P < 0.01, ***P < 0.001; NS, not significant.
