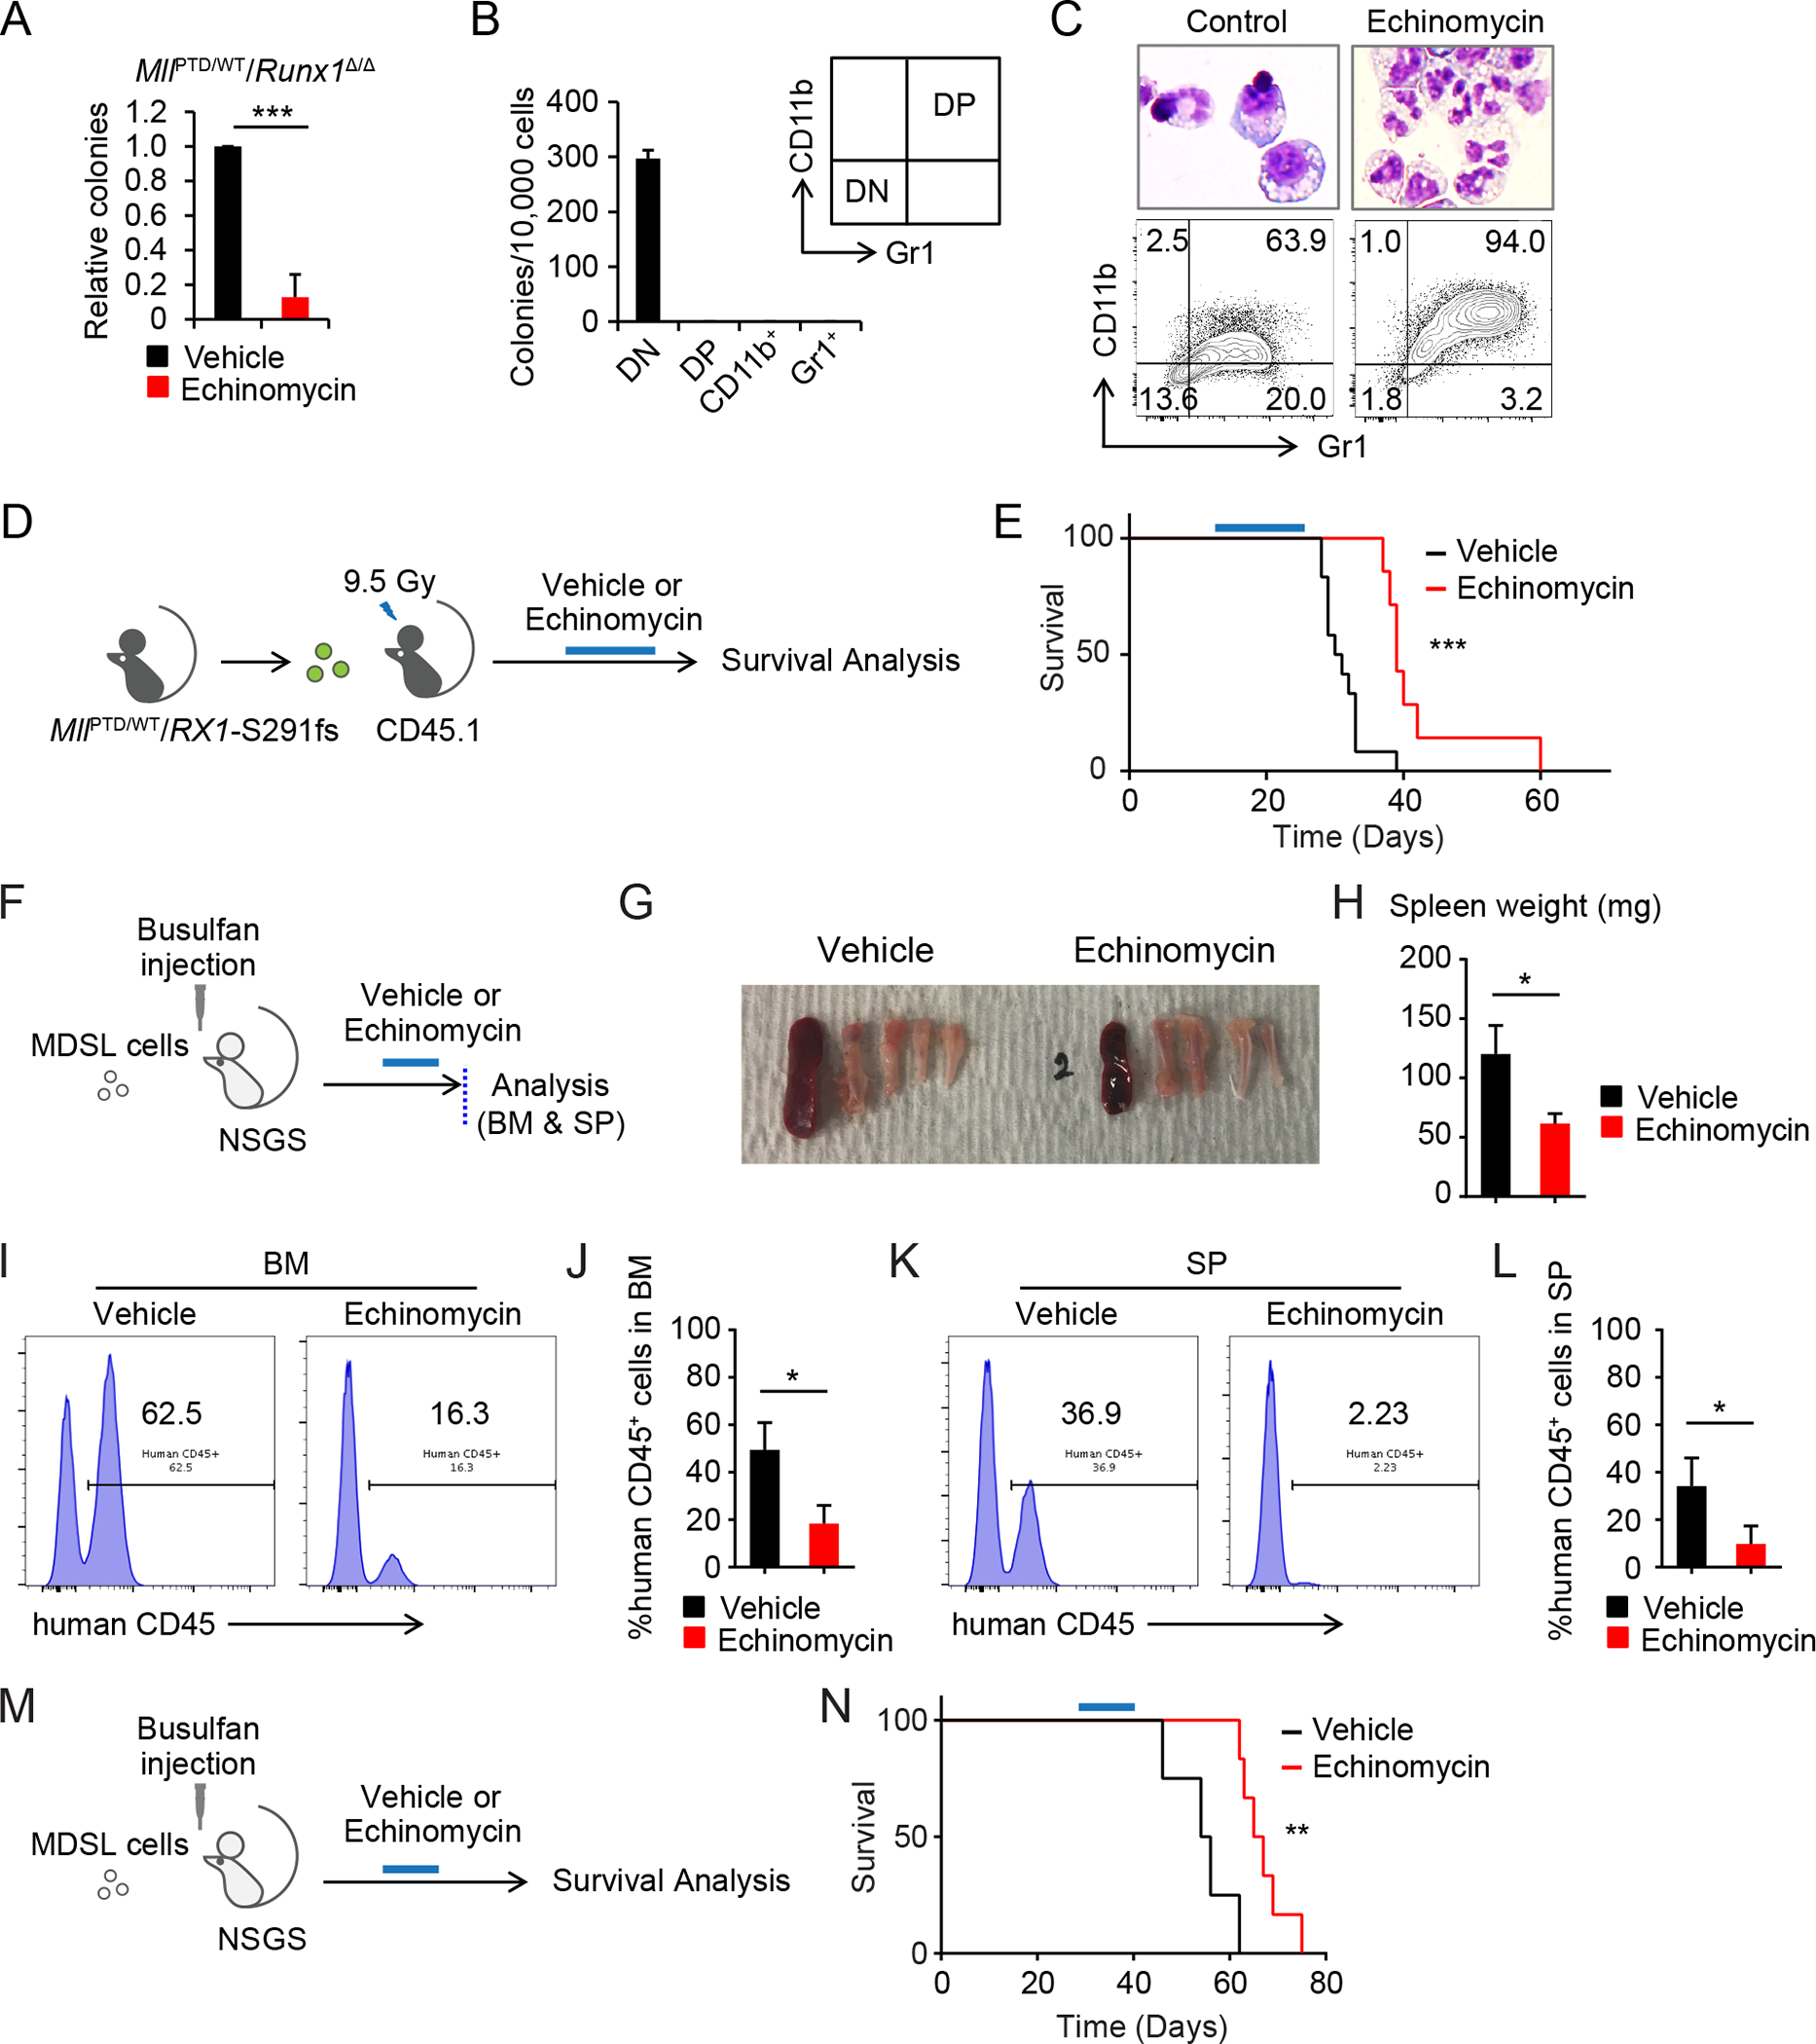
Figure 7. Pharmacological inhibition of HIF1A in MDS pathogenesis.

A, CFU assay of MllPTD/WT/Runx1Δ/Δ cells treated with Echinomycin (1.25 nM). Colony numbers were normalized to those in the control. Data are mean ± s.d. from independent 3 experiments. B, Secondary CFU assay using sorted 1st CFU of MllPTD/WT/Runx1Δ/Δ BM cells. CD11b− Gr1− cells (double negative, DN), CD11+ Gr1− cells (CD11b+), CD11+ Gr1+ cells (double positive, DP), and CD11− Gr1+ cells (Gr1+) were used. Data are mean ± s.d. from triplicate. C, Wright Giemsa staining and flow cytometric analysis of colony forming cells from MllPTD/WT/Runx1Δ/Δ BM cells. D, Schematic of Echinomycin treatment in the MllPTD/WT/Rx1-S291fs BMT mice model. E, Survival of MllPTD/WT/Rx1-S291fs BMT mice with or without Echinomycin treatment (control, n = 12; Echinomycin, n = 8) (E). F-L, Schematic of xenograft of NSGS with MDS-L cells is shown in (F). BM and SP were analyzed after the Echinomycin treatment (n = 4, per each group). Representative appearance of bones and SP (G), spleen weight (H), chimerism of human CD45+ cells in BM (I and J), and SP (K and L) from the indicated group are shown. Data (H, J, and L) are mean ± s.d. M, Schematic of survival analysis of xenograft model. N, Survival of MDS-L transplanted NSGS mice with or without Echinomycin treatment. Treatment was started 4 weeks after xenograft (control, n = 4; Echinomycin, n = 6). *P < 0.05, **P < 0.01, ***P < 0.001.
