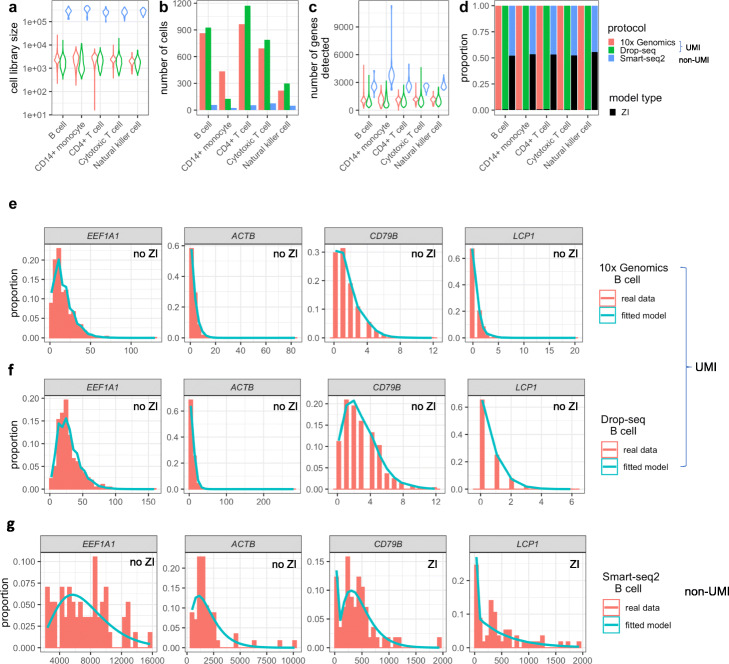
Fig. 5.
Statistical modeling of 10x Genomics, Drop-seq, and Smart-seq2 data for the same PMBC sample. 10x Genomics and Drop-seq data are UMI-based, while Smart-seq2 data are non-UMI-based. a Violin plots showing the distribution of cell library size for each of five PMBC cell types measured by each protocol [43]. For the UMI-based protocols (10x Genomics and Drop-seq) and Smart-seq2, a cell’s library size is defined as the total number of UMIs and reads, respectively, in that cell. b Barplots showing the number of cells detected for each cell type by each protocol. c Violin plots showing the distribution of the number of genes detected per cell. d Barplots showing the proportions of genes for which zero-inflated (ZI) models are chosen (black) and genes for which non-zero-inflated models are chosen (non-black). The model selection is done by likelihood ratio tests. e Four example genes’ UMI count distributions in B cells measured by 10x Genomics. The observed count distributions are shown in histograms. Non-zero-inflated (no ZI) models are chosen, and the fitted model distributions are shown in cyan curves. f The same four example genes’ UMI count distributions counts in B cells measured by Drop-seq. g The same four example genes’ read count distributions in B cells measured by Smart-seq2. ZI models are chosen for two genes

