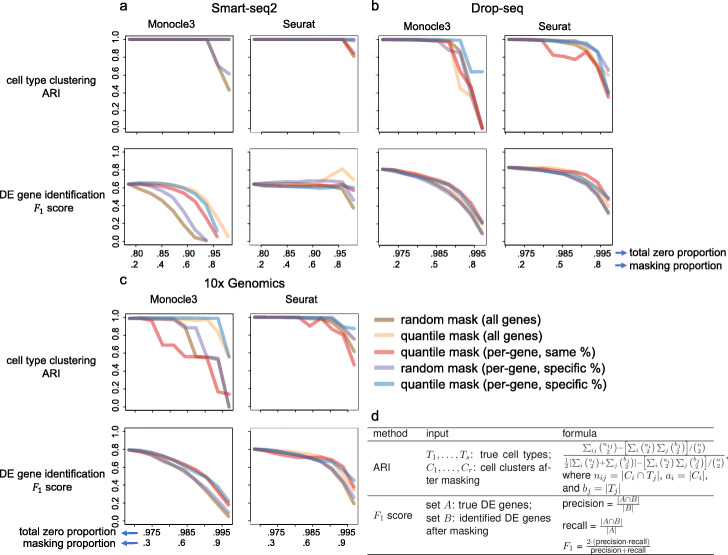
Fig. 6.
Effects of non-biological zeros on cell clustering and DE gene identification. We introduce a varying number of non-biological zeros, which correspond to masking proportions 0.1–0.9, into the simulated a Smart-seq2, b Drop-seq, and c 10x Genomics datasets using five masking schemes. The horizontal axes show (top) the total zero proportion (including the zeros before masking and the non-biological zeros introduced by masking) and (bottom) the masking proportion (i.e., the proportion of non-zero counts masked by a masking scheme). After introducing non-biological zeros, we apply Monocle 3 and Seurat to each dataset to perform cell clustering and identify DE genes. For the two analyses, we evaluate their accuracy using the adjusted rand index (ARI) and F1 score (given the false discovery rate 5%), respectively. d Technical definitions of the ARI and F1 score

