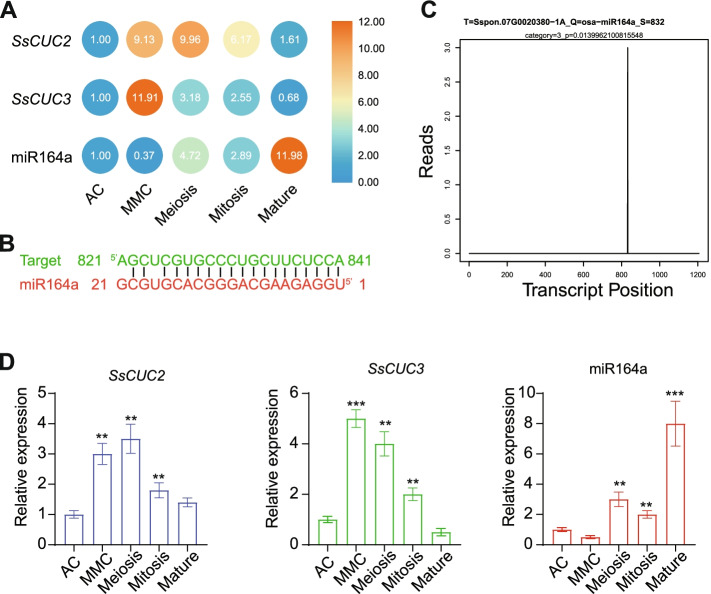
Fig. 5.
Expression and regulation of sugarcane CUC genes. A The expression patterns of SsCUC2, SsCUC3 and miR164a in different developmental stages of ovules. The expression level for the AC stage was set to 1.0, and the data presented in MMC, Meiosis, Mitosis and Mature is relative to AC. B Predicted target site in SsCUC2 by psRNATarget database. C Target plot (T-plot) indicating the cleavage event mediated by miR164 on the PARE-seq. D RT-qPCR of SsCUC2, SsCUC3 and miR164a in different developmental stages of ovules. Sugarcane β-actin was used as an internal control. The expression level was set to 1.0 (for AC), and the data presented relative transcript abundance to AC. The threshold cycle (CT) values were used to calculate relative expression using the 2−ΔΔCT method. The data represent the means ± SE of three replicates, and asterisks denote statistically significant values (**p < 0.01 and *** p < 0.001)

