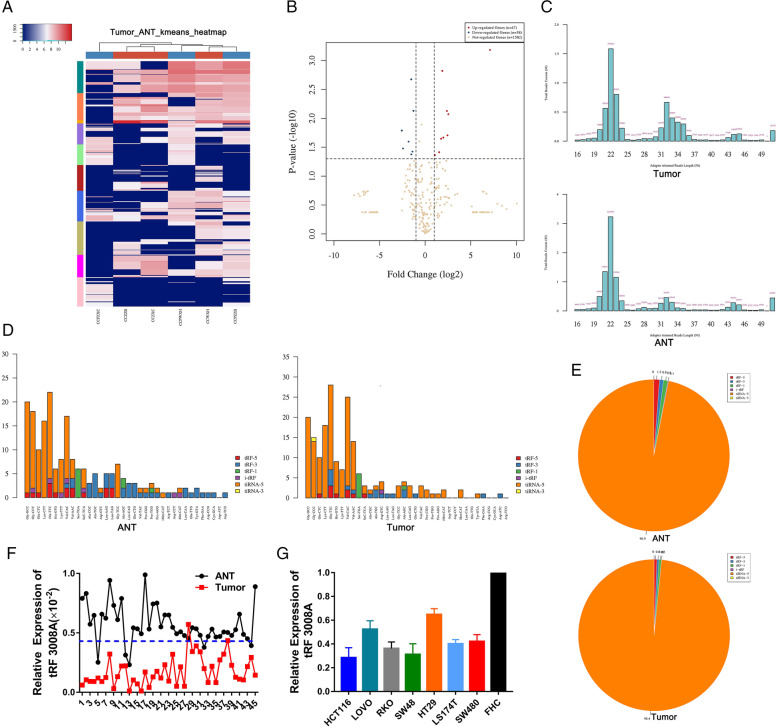
Fig. 1.
Genome-wide profiling of tRFs in colorectal cancer. A&B Clustered heat map and volcano plots of the differentially expressed tRFs in three pairs of CRCs (CCWXH, CCZZB, CCZXC) and adjacent non-tumorous tissues (CCPWXH, CCPZZB, CCPZXC). Rows represent tRNAs; while columns represent tissues (top red: tumors; top blue: ANTs). C The length distribution of tRFs in CRC and adjacent non-tumorous tissues. D&E Genomic origin of the tRFs identified in human CRC and adjacent non-tumorous tissues. F. RT-qPCR to validate tRF3008A expression in 45 pairs of CRCs and adjacent non-tumorous tissues. G. RT-qPCR to validate tRF3008A expression in 7 CRC cell lines and human colon epithelial cell line. Statistical significance is measured using Student’s t test

