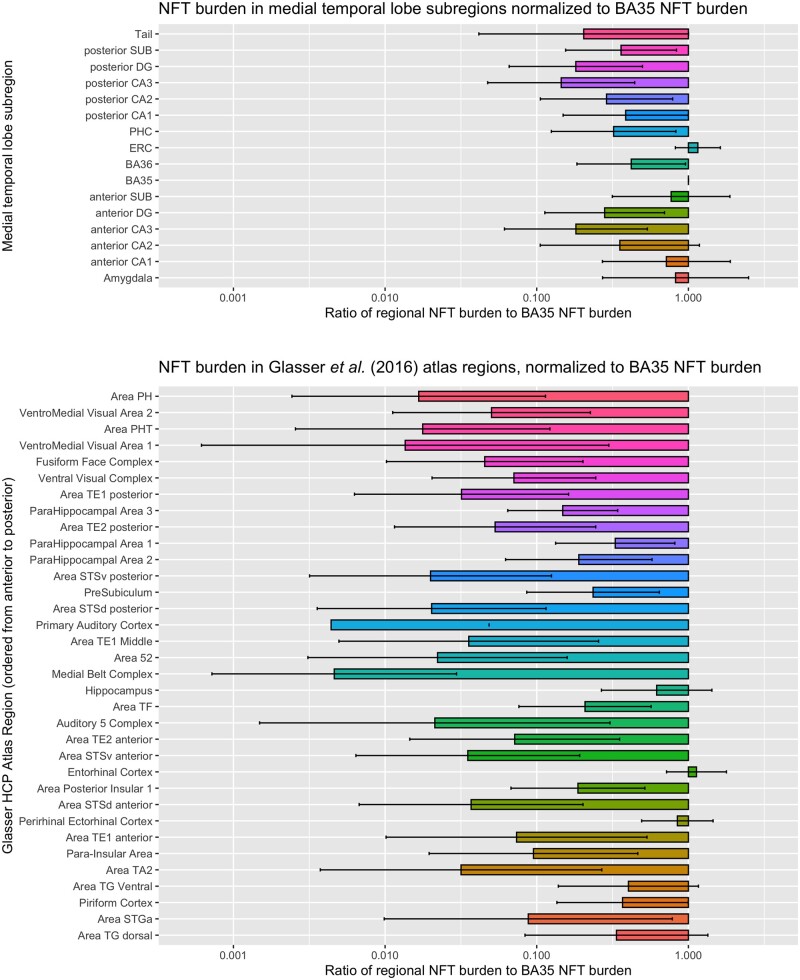
Figure 7.
Summary measures of tau NFT burden in two sets of anatomical regions defined in template space. The top plot includes hippocampal subfields and subregions of the parahippocampal gyrus. The bottom plot includes 35 regions from the Human Connectome Project Multi-Modality Parcellation (MMP) atlas33 that cover the temporal lobe. For each region, the horizontal bars plot the ratio of NFT burden in that region to the NFT burden in BA35, which is thought to encompass the earliest site of cortical NFT formation in Alzheimer’s disease. For each region in each specimen, the summary measure of NFT burden is obtained by taking the 90th percentile of the regional NFT burden measure. Larger values in the plot indicate greater vulnerability to NFT pathology relative to BA35, while smaller values indicate that regions are spared from NFT pathology relative to BA35. Each set of regions is roughly arranged in the order from more posterior (top of plot) to more anterior (bottom of plot), indicating a presence of a posterior-anterior gradient in relative NFT burden, with posterior structures more spared relative to the anterior structures. These plots use data from 15 of 18 cases in Fig. 5, excluding three cases with primary FTLD-Tau diagnosis.

