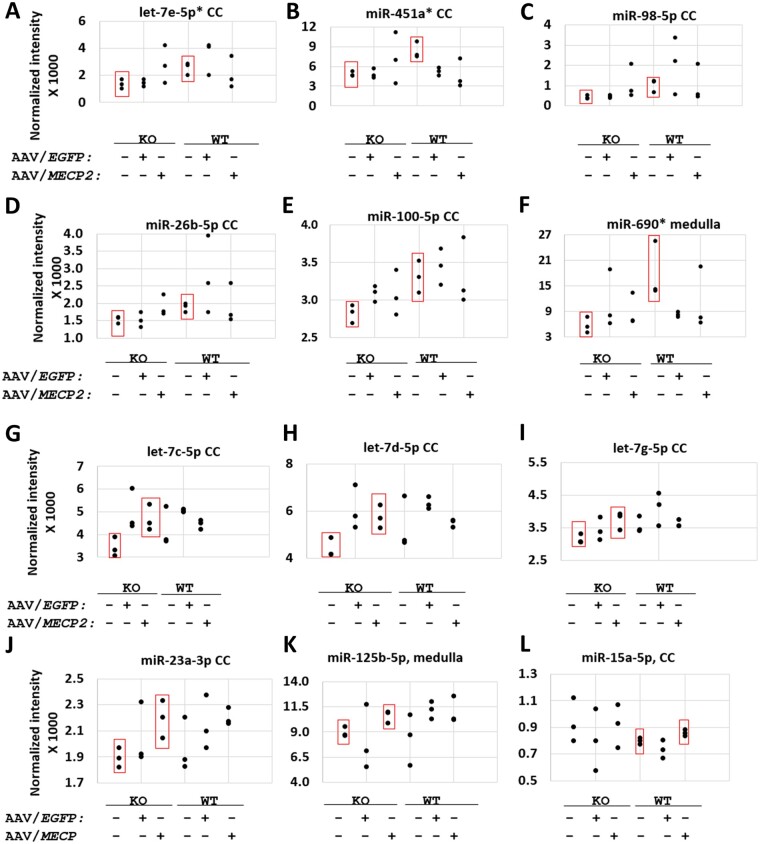
Figure 3.
Putative positive hits upregulated in correlation with endogenous or exogenous MECP2 according to miRNA microarray. (A–F) Significant differences between saline-treated knockout (KO) and saline-treated wild-type (WT) mice. (G–L) Significant differences between saline-treated and AAV9/MECP2-treated mice. (A–L) None of the 12 miRNAs listed here were significantly upregulated by AAV9/EGFP (versus saline-treated knockout or wild-type mice; P > 0.05). Each data-point represents the average of two screening replicates; error bars for each mean are not shown. n = 3 mice per group. P < 0.05 between the groups boxed in red. *A ‘reg1’ miRNA target panel featuring binding sites for miR-451a, miR-690, and let-7e-5p failed to improve the safety of miniMECP2 gene transfer (data not shown). As discussed in the main text, negative results (P > 0.05) should be interpreted with caution, as miRNAs upregulated at the cell-type level may be masked by noise from other cell types in the same tissue. Furthermore, low normalized fluorescence intensities may reflect low miRNA expression levels in a tissue sample but may fail to reveal high expression levels within a single cell type within said tissue. In general, many of the significant differences in normalized fluorescence intensity are for relatively small increases in mean signal between the indicated treatment groups. These subtle changes, along with the general noisiness of the data, warranted a secondary technique to justify the use of specific miRNA targets within a new target panel design. Finally, miRNAs significantly upregulated by AAV9/EGFP (versus saline-treated knockout mice) are miR-99a-5p, miR-107-3p and let-7f-5p in cervical cord (CC; data not shown). MiRNAs upregulated by AAV9/EGFP (versus saline-treated wild-type mice) are miR-669a-3p in cervical cord; let-7j in cerebellum; and miR-669f-3p, miR-669p-3p, miR-30c-5p and miR-669a-3p in medulla (data not shown).

