Figure 6.
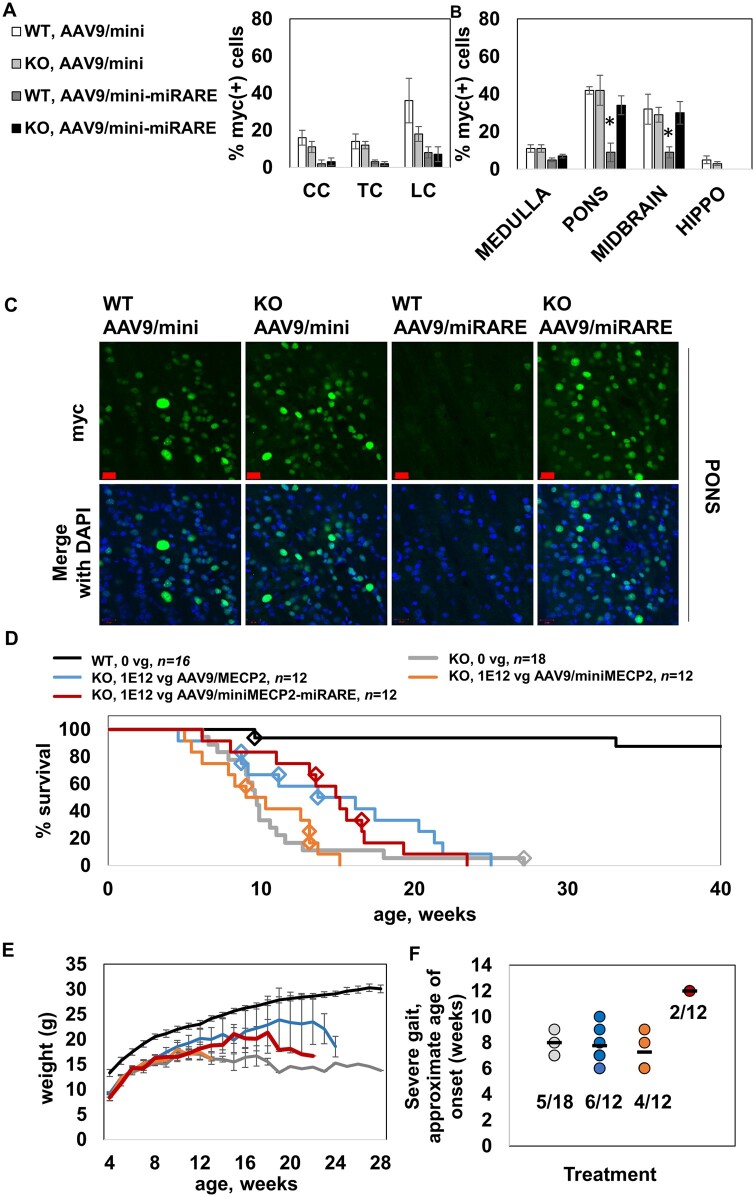
AAV9/miniMECP2-miRARE extends the survival of knockout mice despite regulation. (A) Percentage of myc+ cells is shown for cervical cord (CC), thoracic cord (TC) and lumbar cord (LC). MiRARE provided robust regulation across host genotypes. n = 3–5 mice per group. (B) Percentage of myc+ cells is shown. MiRARE significantly decreased expression in the pons and midbrain of AAV9/miniMECP2-miRARE-treated wild-type mice. P < 0.05 versus all other groups. The same legend applies for A and B. (C) Representative pons images. Scale bars = 20 µm. (D) Median survivals for saline- and AAV9/miniMECP2-miRARE-treated knockout mice are 9.6 and 15.0 weeks (P < 0.02). Compare to lower doses shown in Supplementary Fig. 9. Diamonds indicate veterinarian-requested euthanasias, which were primarily for severe tail lesions or tail self-amputations. (E) None of the treatments affected knockout weight. Any trends in increased weight for virus-treated knockout mice (versus saline-treated knockout mice) are insignificant because few mice are alive at later time points. n per group in E: wild-type, 0 vg (20); knockout, 0 vg (18); knockout, 1 × 10¹² vg AAV9/MECP2 (12); knockout, 1 × 10¹² vg AAV9/miniMECP2 (12); and knockout, 1 × 10¹² vg AAV9/miniMECP2-miRARE (12). (D and E) The same wild-type control data appear in Fig. 5 as these mice were treated in parallel. (F) The frequency of achieving severe gait (score = 2) among saline-, AAV9/MECP2-, AAV9/miniMECP2- and AAV9/miniMECP2-miRARE-treated mice were 28%, 50%, 33% and 17%. Each mouse was administered 1 × 10¹² vg. Black bars indicate the mean age of onset for severe clasping. Each data-point represents one mouse. Treatment groups are colour-coded as shown in D and E. The fraction of mice (subset versus entire group) is listed for each treatment group. AAV9/miniMECP2-miRARE-treated mice developing severe gait (n = 2 of 12) did so 4–5 weeks after other groups. Although this delay is significantly different, the number of data-points are too few to draw firm conclusions. Figure 5D and F show the same type of data. In general, Kaplan–Meier plots are the clearest way to visually communicate age-of-onset data (Fig. 5D), but these plots lend themselves to the assumption that all mice retaining normal gait live for the entire time period specified on the x-axis. This is true for wild-type mice (Fig. 5D) but not for knockout mice (F). Importantly, few AAV9/miniMECP2-miRARE-treated knockout mice developed severe gait, despite having an extended survival. For a graphical comparison, see Supplementary Fig. 8 for wild-type scatter plot data (also presented in Fig. 5D). (A, B and E) Data are mean ± SEM.

