Figure 3.
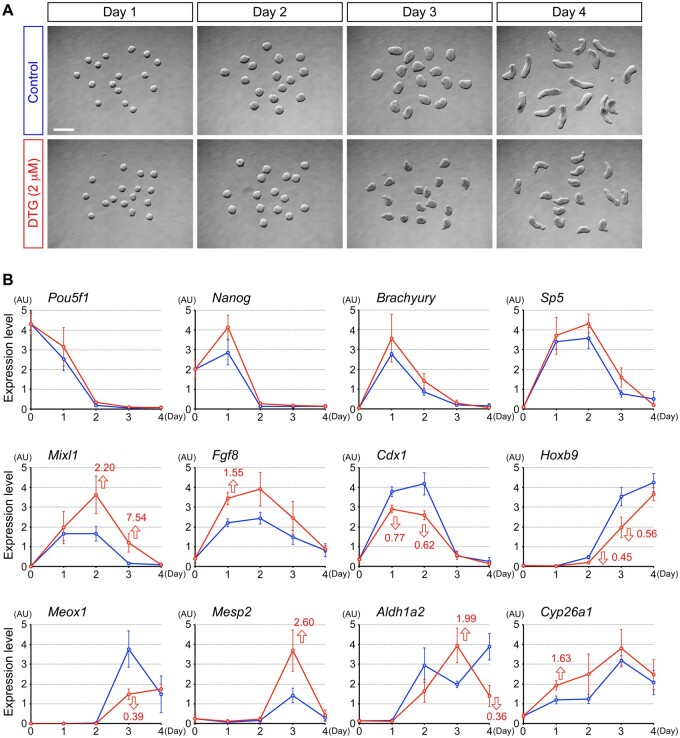
Dolutegravir (DTG) alters temporal gene expression profiles of developmental regulators. A, Representative images of control and DTG-treated cell aggregates at different stages. Scale bar = 500 μm. B, Quantitative reverse transcription-polymerase chain reaction analysis of temporal gene expression patterns over the course of 4 days of culture. Graphs show averages of relative expression levels with error bars of SD, presented in arbitrary unit (AU). Blue and red lines correspond to control and DTG-treated aggregates, respectively. Red numbers with open arrows indicate fold differences with statistical significance (q < 0.05; 2-sample t test with the false discovery rate adjustment) between control and DTG-treated group at a given day.

