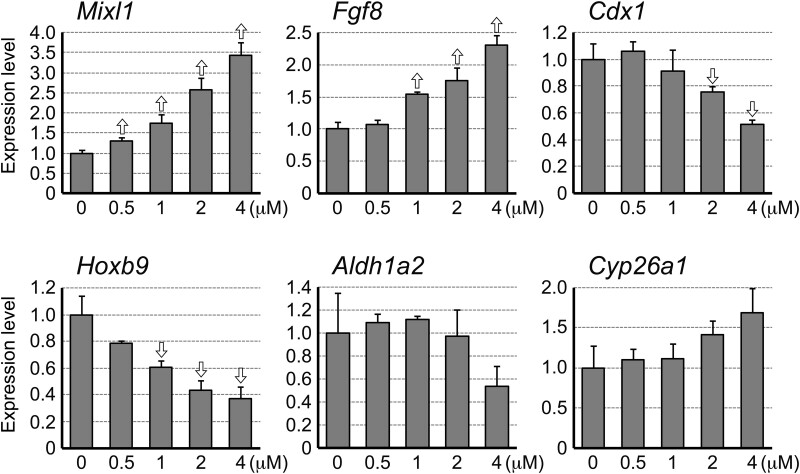
Figure 4.
Dolutegravir (DTG) alters gene expression levels in a dose-dependent manner. Quantitative reverse transcription-polymerase chain reaction analysis of day 2 aggregates. Graphs show averages of relative expression levels with error bars of SD. Open arrows indicate statistically significant differences (p < .02; 2-sample t test) compared with the corresponding control (0 μM).

