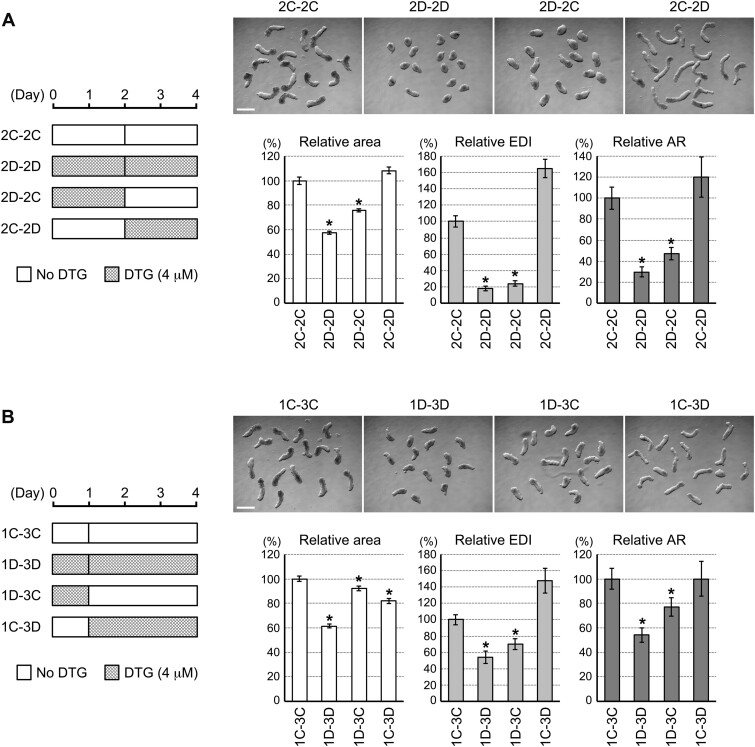
Figure 5.
Morphological impact of dolutegravir (DTG) depends on timing of exposure. A, The 2–2 day treatment regimen. (Left) The schematic diagrams depicting how the first and last 2 days are exposed to DTG in each group. (Top) Representative images of day 4 aggregates that correspond to the left diagram. Scale bar = 500 μm. (Bottom) Graphs showing averages of relative area, relative elongation distortion index (EDI), and relative aspect ratio (AR) with error bars of 95% CI. Asterisks indicate significant reduction (p < .01; 2-sample t test) compared with the corresponding control (2C-2C). B, The 1–3 day treatment regimen. The same descriptions as in (A).

