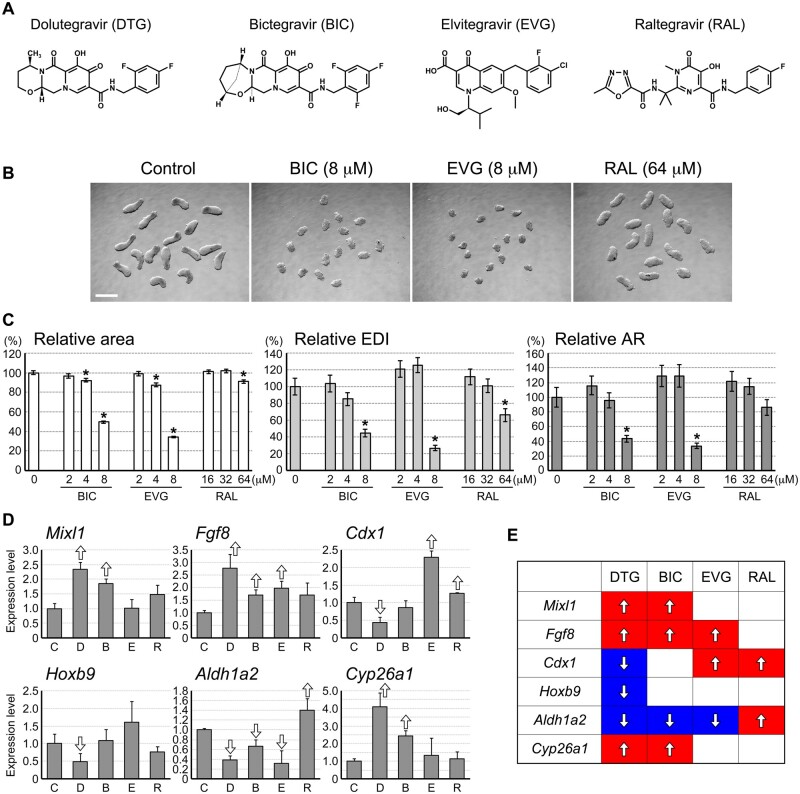
Figure 6.
Morphogenesis model is differentially affected by integrase strand transfer inhibitors (INSTIs). A, Chemical structures of INSTIs. B, Representative images of day 4 aggregates treated with bictegravir (BIC), elvitegravir (EVG), and raltegravir (RAL). C, Morphometric parameters of day 4 cell aggregates. Graphs show averages of relative area, relative elongation distortion index (EDI), and relative aspect ratio (AR) with error bars of 95% CI. Asterisks indicate significant reduction (p < .01; 2-sample t test) compared with the corresponding control (0 μM). D, Quantitative reverse transcription-polymerase chain reaction analysis of day 2 aggregates that have been treated with vehicle only control (C), DTG (D; 4 μM), BIC (B; 8 μM), EVG (E; 8 μM), and RAL (R; 64 μM). Graphs show averages of relative expression levels with error bars of SD. Open arrows indicate statistically significant differences (p < .02; 2-sample t test) compared with the corresponding control (0 μM). E, Comparisons of gene expression change in response to exposure to INSTIs, based on the data in (D). Red and blue indicate up- and down-regulation compared with the control level, respectively.

