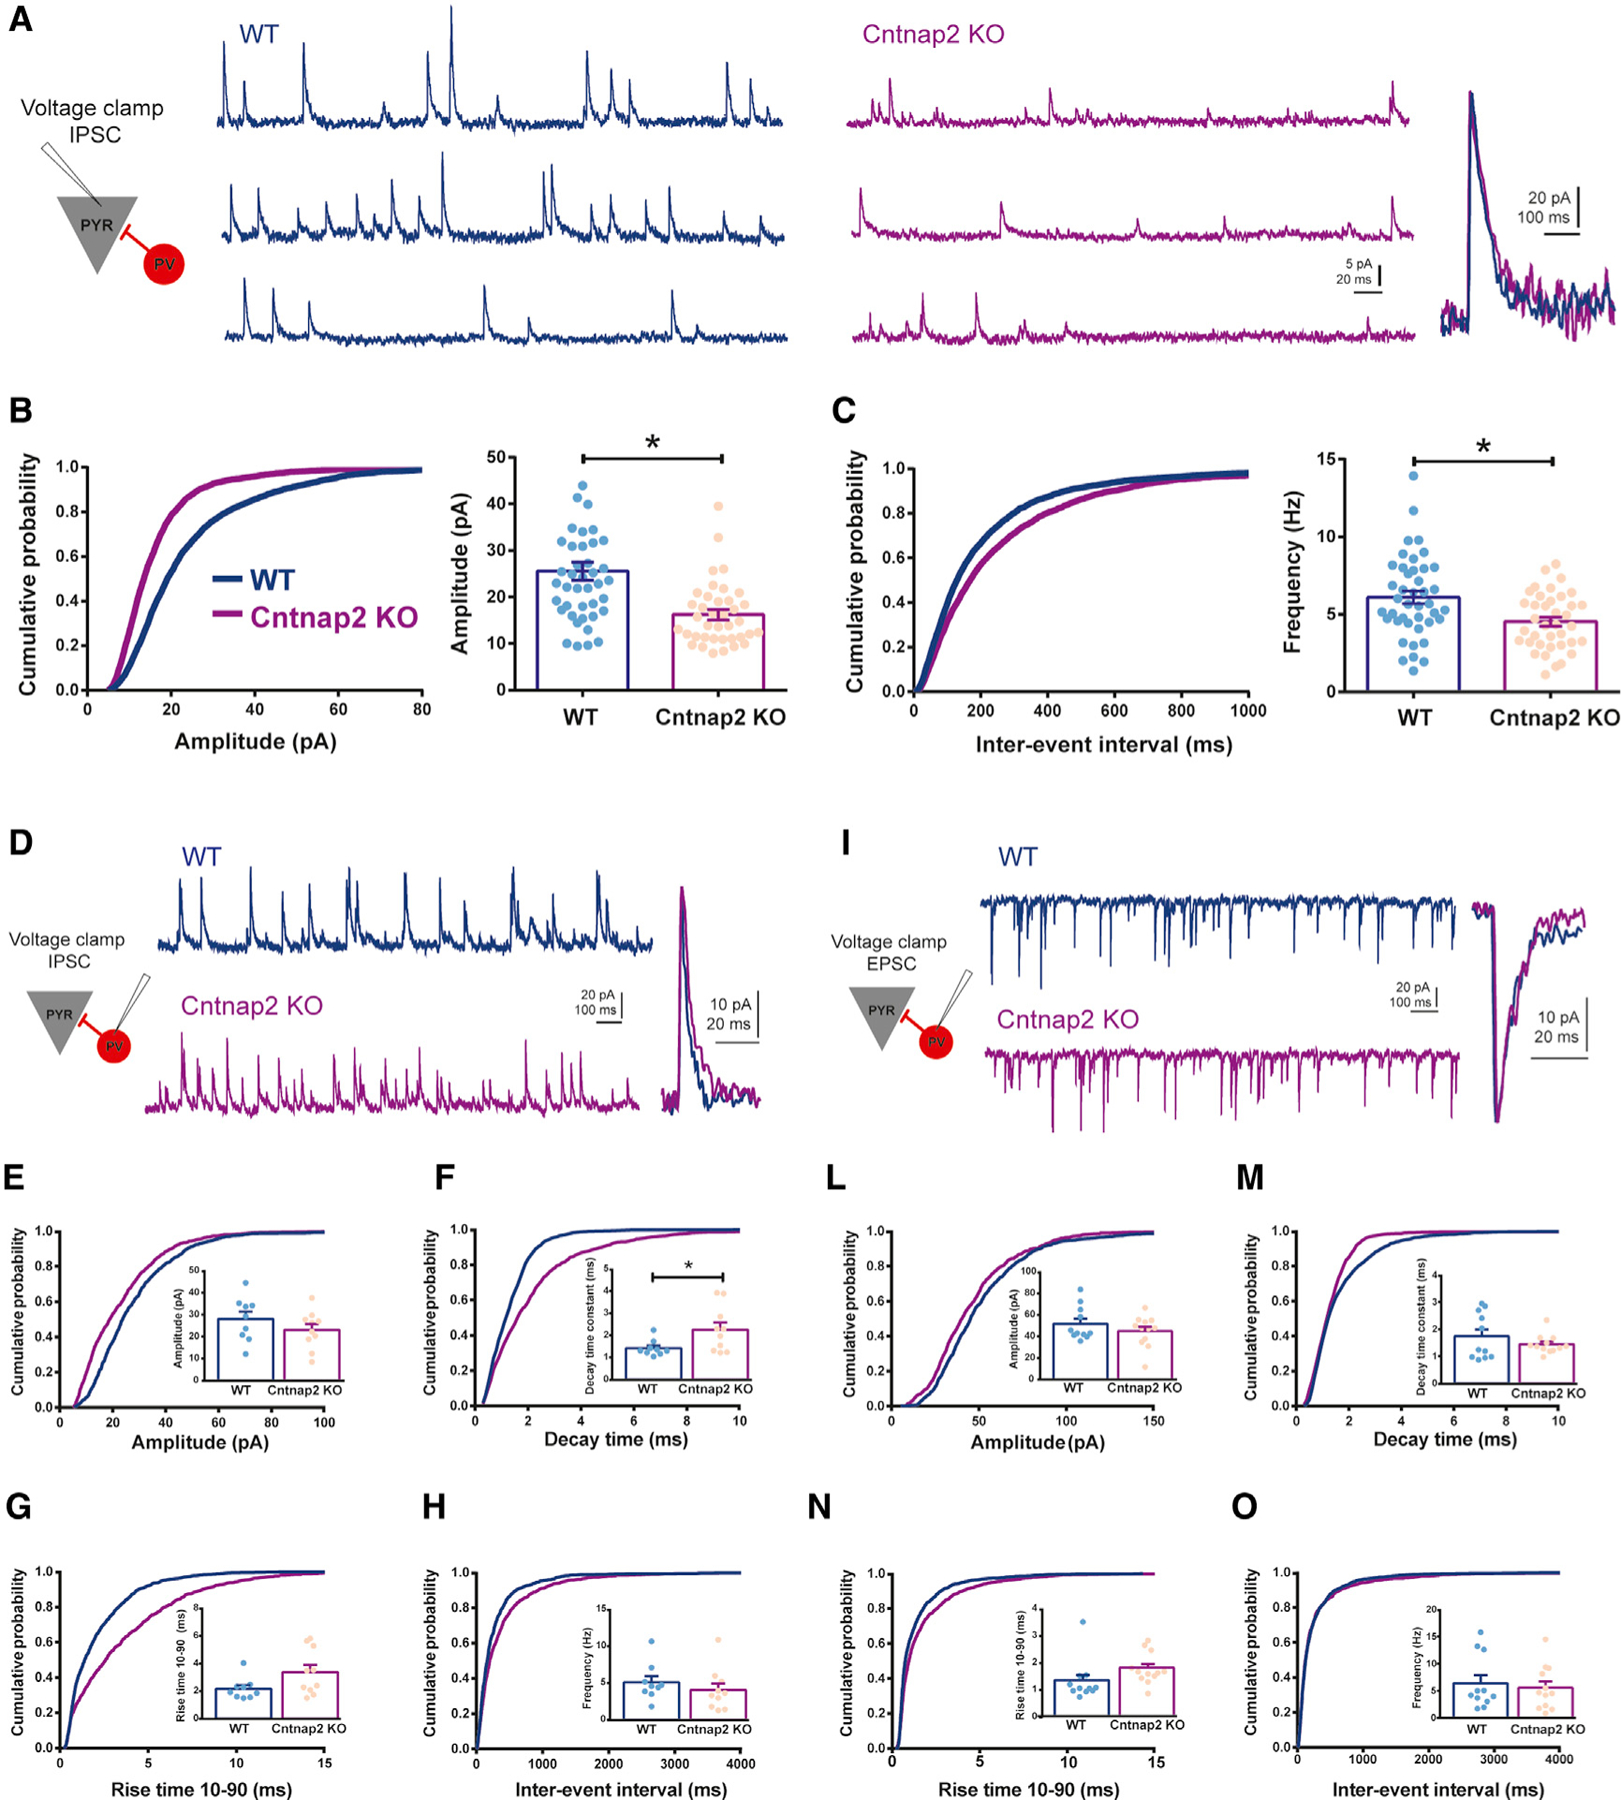
Figure 2. Decreased inhibition in CA1 pyramidal neurons in Cntnap2 KO mice.

(A) Representative traces of IPSCs recorded from CA1 pyramidal neurons in WT and Cntnap2 KO mice, voltage-clamped at 0 mV, with normalized unitary events (left) demonstrating no differences in the kinetics of IPSCs.
(B) Cumulative distribution and average of IPSC amplitude recorded from pyramidal neurons (WT: 24.24 ± 1.51 pA, n = 41, 7 mice; Cntnap2 KO: 16.22 ± 1.09 pA, n = 38, 8 mice; two-tailed unpaired t test, t (4.22), p < 0.0001; cumulative distribution, Kolmogorov-Smirnof [K-S] test: WT versus KO p < 0.0001).
(C) Cumulative distribution and average plots of IPSC frequency recorded from pyramidal neurons (WT: 6.13 ± 0.41 Hz, n = 41, 7 mice; Cntnap2 KO: 4.54 ± 0.29 Hz, n = 38, 8 mice; two-tailed unpaired t test, t (3.08), p = 0.0029; cumulative distribution, K-S test: WT versus KO p < 0.0001). Note a decreased IPSC amplitude and frequency in pyramidal neurons in Cntnap2 KO mice.
(D–H) Whole-cell patch-clamp IPSC recording from PV+ interneurons located in CA1 pyramidal cell layer in WT and Cntnap2 KO mice.
(D) Representative traces of IPSCs voltage-clamped at 0 mV, with corresponding normalized unitary events in WT and Cntnap2 KO mice.
(E) IPSC amplitude (WT: 28.02 ± 3.33 pA, n = 9, 7 mice; Cntnap2 KO: 23.07 ± 2.70 pA, n = 10, 6 mice; two-tailed unpaired t test, t (1.16), p = 0.2612; cumulative distribution, K-S test: WT versus KO p < 0.0001).
(F) IPSC decay time constant (WT: 1.41 ± 0.12 ms, n = 9, 7 mice; Cntnap2 KO: 2.249 ± 0.32 ms, n = 10, 6 mice; two-tailed unpaired t test, t (2.310), p = 0.0337; cumulative distribution, K-S test: WT versus KO p < 0.0001).
(G) IPSC rise time 10–90 (WT: 2.16 ± 0.26 ms, n = 9, 7 mice; Cntnap2 KO: 3.36 ± 0.52 ms, n = 10, 6 mice; two-tailed unpaired t test, t (1.982), p = 0.0638; cumulative distribution, K-S test: WT versus KO p < 0.0001).
(H) IPSC frequency (WT: 5.06 ± 0.83 Hz, n = 9, 7 mice; Cntnap2 KO: 4.02 ± 0.90 Hz, n = 10, 6 mice; two-tailed unpaired t test, t (0.84), p = 0.41; cumulative distribution, K-S test: WT versus KO p < 0.0001).
(I–O) Whole-cell patch-clamp EPSC recording from PV+ interneurons located in CA1 pyramidal cell layer in WT and Cntnap2 KO mice.
(I) Representative traces of EPSCs voltage-clamped at ‒65 mV, with corresponding normalized unitary events in WT and Cntnap2 KO mice.
(L) EPSC amplitude (WT: 51.76 ± 4.73 pA, n = 11, 7 mice; Cntnap2 KO: 44.87 ± 4.13 pA, n = 12, 6 mice; two-tailed unpaired t test, t (1.102), p = 0.2831; cumulative distribution, K-S test: WT versus KO p < 0.0001).
(M) EPSC decay time constant (WT: 1.73 ± 0.25 ms, n = 11, 7 mice; Cntnap2 KO: 1.43 ± 0.099 ms, n = 12, 6 mice; two-tailed unpaired t test, t (1.123), p = 0.2742; cumulative distribution, K-S test: WT versus KO p < 0.0001).
(N) EPSC rise time 10–90 (WT: 1.33 ± 0.23 ms, n = 11, 7 mice; Cntnap2 KO: 1.79 ± 0.16 ms, n = 12, 6 mice; two-tailed unpaired t test, t (1.639), p = 0.1162; cumulative distribution, K-S test: WT versus KO p < 0.0001).
(O) EPSC frequency (WT: 6.38 ± 1.50 Hz, n = 11, 7 mice; Cntnap2 KO: 5.55 ± 1.17 Hz, n = 12, 6 mice; two-tailed unpaired t test, t (0.44), p = 0.66; cumulative distribution, K-S test: WT versus KO p = 0.87). Results are expressed as mean ± SEM. IPSCs, inhibitory postsynaptic currents; EPSCs, excitatory postsynaptic currents. Data are presented as mean ± SEM.
