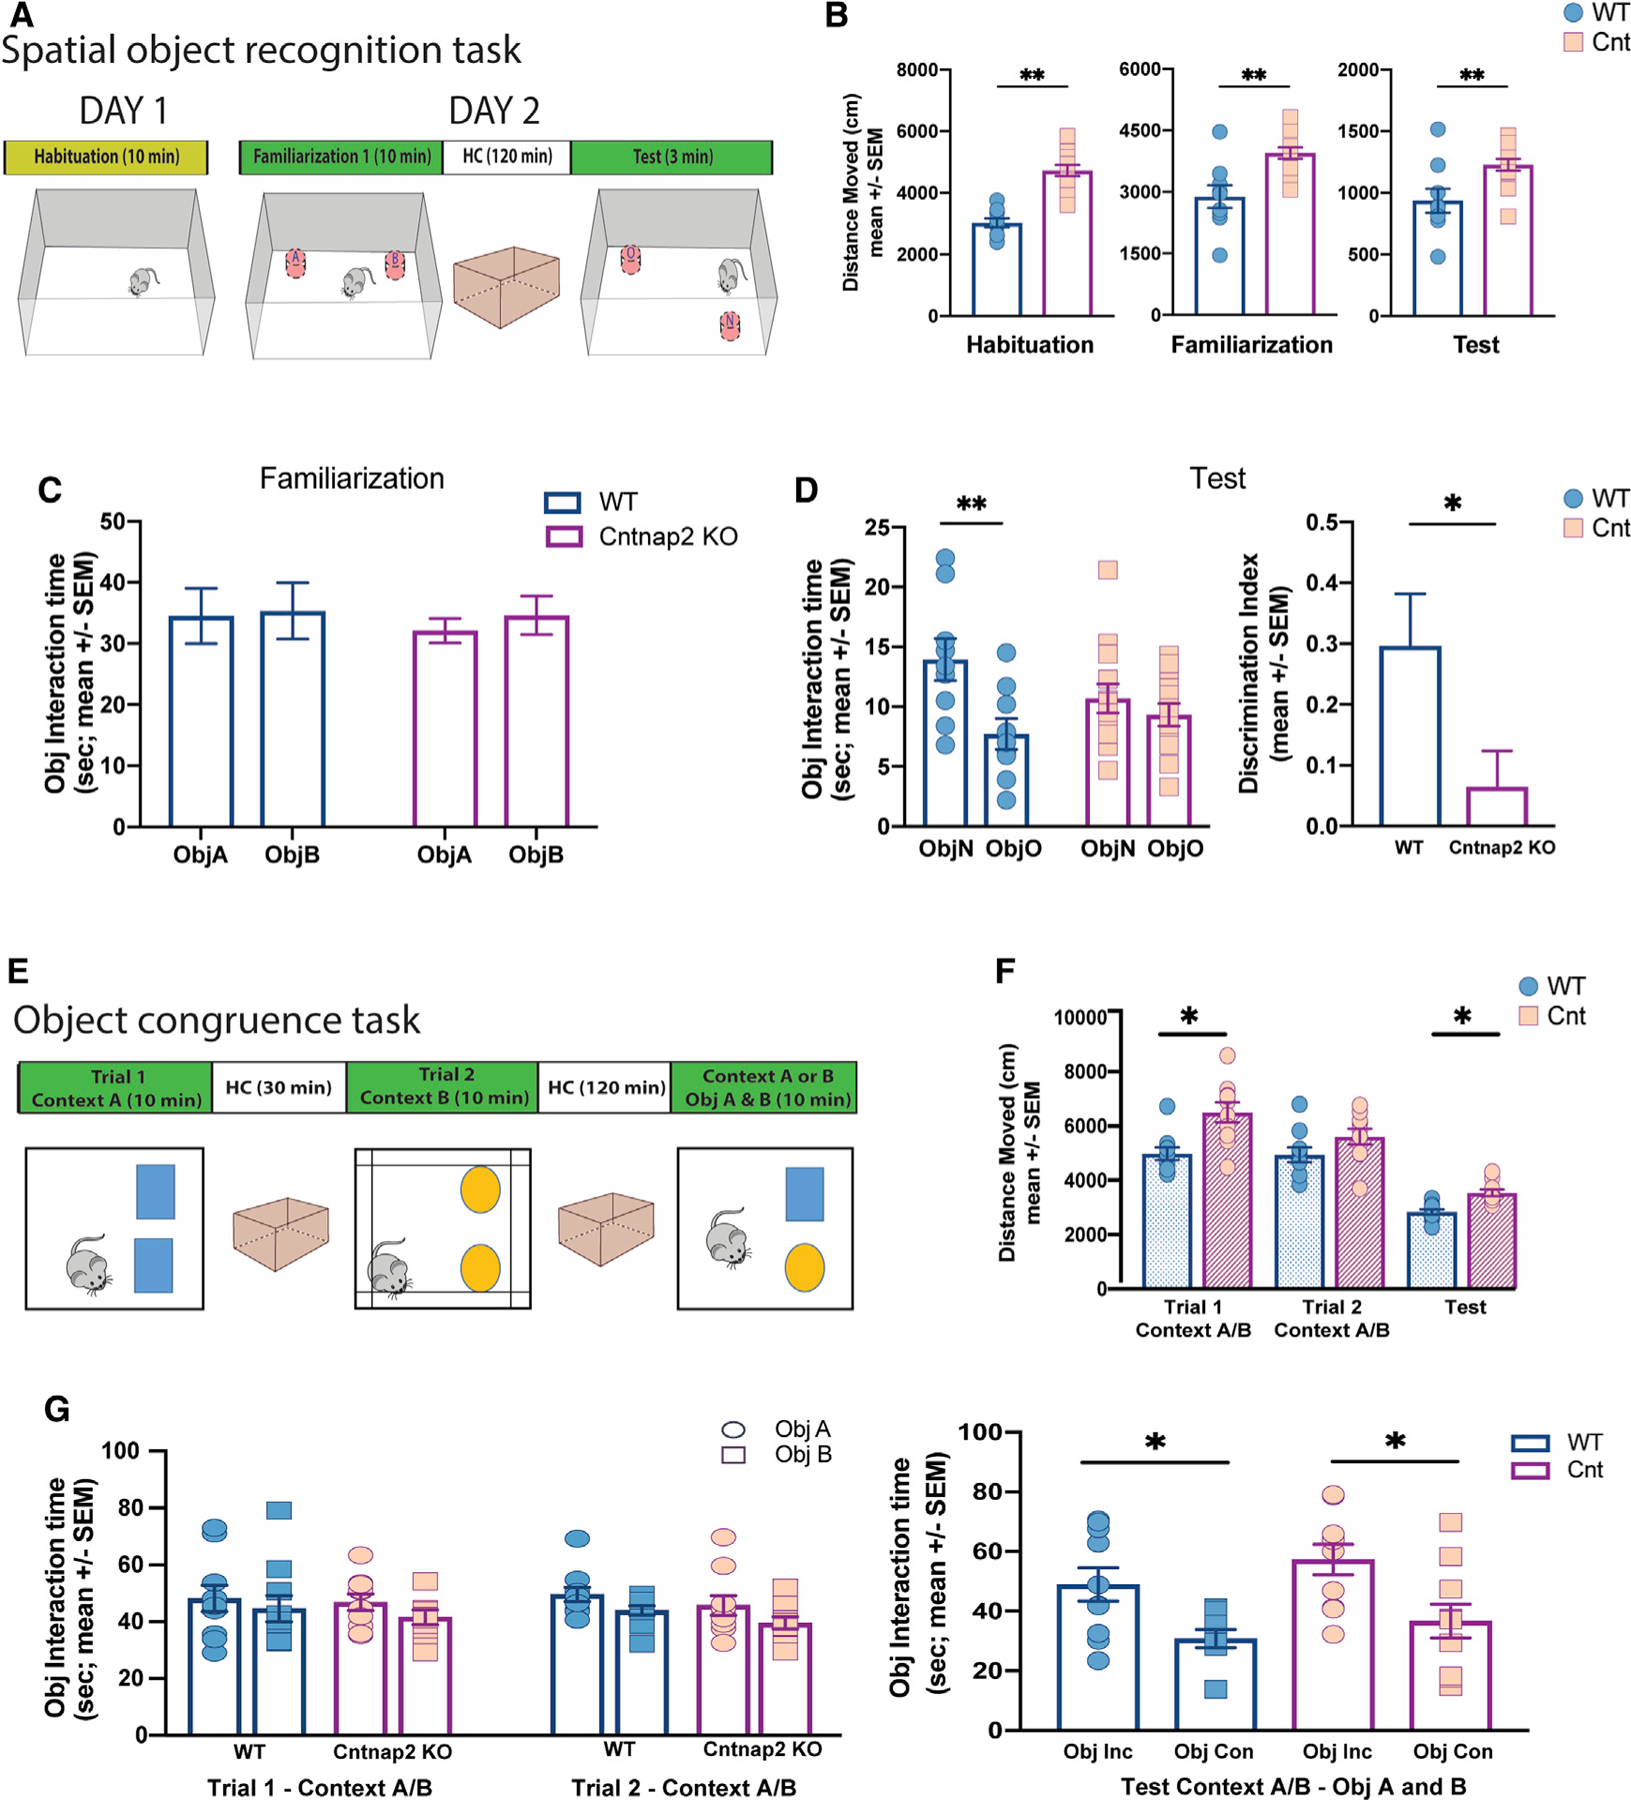
Figure 3. Spatial object recognition memory compromised in Cntnap2 KO mice.

(A) Schematic representation of the one-trial spatial object recognition task. The scheme displays the sequence of the trials across days and the position of the objects in the task during familiarization and test.
(B) Total exploratory distance during habituation (10 min), familiarization (10 min), and test (3 min) in control (n = 9) and Cntnap2 KO (n = 13) mice. Note the hyperactive performance in Cntnap2 KO mice across all trials. Unpaired t test (habituation), t (20), p < 0.001. Unpaired t test (familiarization), t (12.1), p < 0.01. Unpaired t test (test), t (11.9), p < 0.03.
(C) Cumulative time exploring objects during familiarization (ANOVA p > 0.05).
(D) Left panel: cumulative time exploring objects during test (ANOVA p < 0.05; Sidak’s multiple comparisons test, WT object [Obj] A versus Obj B: p < 0.001, Cntnap2 KO Obj A versus Obj B: p = 0.6). Right panel: discrimination Index (DI) in WT and Cntnap2 KO during test. Unpaired t test, t (15.3), p < 0.05. Note that Cntnap2 KO were not able to discriminate the object moved in the new location.
(E) Schematic representation of the object congruence task. The scheme displays the different contexts and the objects features and location in the task.
(F) Total exploratory distance across trials in control (n = 10) and Cntnap2 KO (n = 10) mice. Unpaired t test trial 1, t (15.1), p < 0.01; unpaired t test trial 2, t (17.9), p = 0.1; unpaired t test test, t (17), p < 0.01. Note that Cntnap2 KO showed hyperactivity during task performance.
(G) Left: Cumulative time exploring objects during trials 1 and 2. (ANOVA p > 0.05). Right: Cumulative time exploring objects during test (ANOVA p < 0.05; Sidak’s multiple comparisons test, WT Obj congruent versus Obj non-congruent: p < 0.03; Cntnap2 KO Obj congruent versus Obj non-congruent: p < 0.01). Note that both animal conditions, WT and Cntnap2 KO, were able to discriminate the object not congruent with the context.
Data are presented as mean ± SEM.
