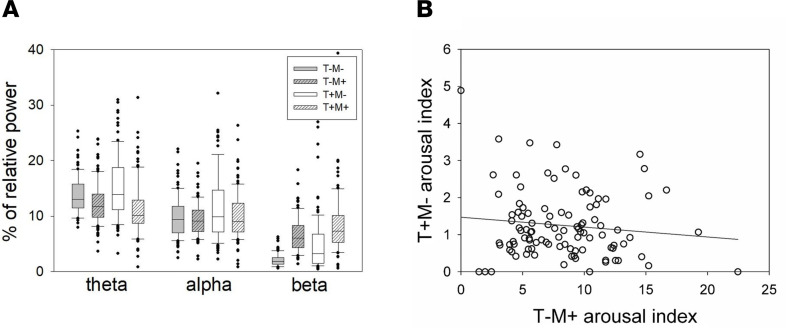
Figure 2. Spectral composition of arousal types.
(A) Box plot of relative power in the θ (4.5–7.5 Hz), α (8.5–11.5 Hz), and β (16.5–29.5 Hz) band for T–M–, T–M+, T+M–, and T+M+ arousals with error bars. The boxes’ central lines indicate the median of power values, with the bottom and upper edges showing the 25th and 75th percentiles, respectively. T, arousal associated (T+) or not (T–) with sleep stage transition; M, arousal associated (M+) or not (M–) with an increase in EMG tone. Indexes correspond to hourly prevalence. (B) Absence of significant correlation between T–M+ arousals and T+M– arousals (Spearman’s r = –0.05; P = 0.60).

