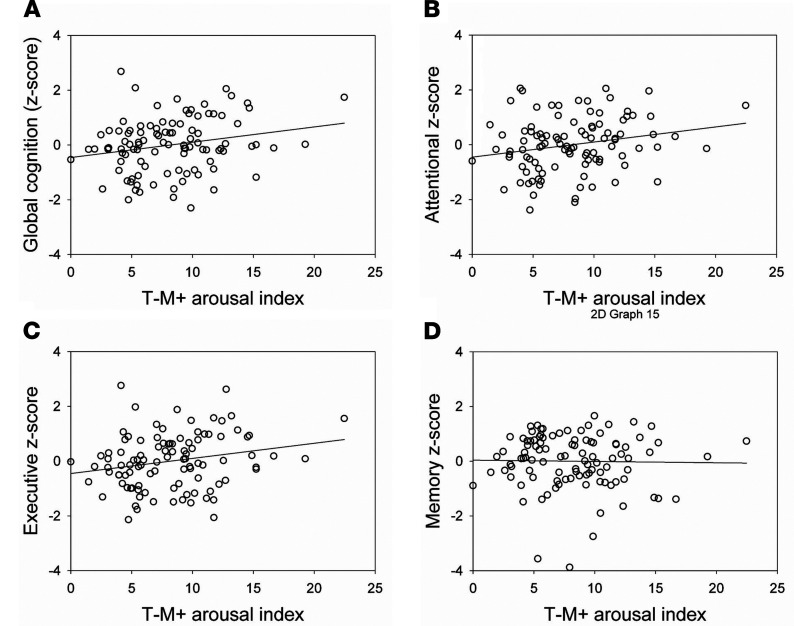
Figure 4. Association between T–M+ arousals prevalence and cognitive performance.
(A) T–M+ arousals and global cognition (Spearman’s r = 0.21, P = 0.04); (B) T–M+ arousals and attention (Spearman’s r = 0.22, P = 0.03); (C) T–M+ arousals and executive functioning (Spearman’s r = 0.21, P = 0.03); (D) T–M+ arousals and memory (Spearman’s r = –0.03, P = 0.71). See Table 3 for full GLMM outputs. T, arousal associated (T+) or not (T–) with sleep stage transition; M, arousal associated (M+) or not (M–) with an increase in EMG tone. Indexes correspond to hourly prevalence.

