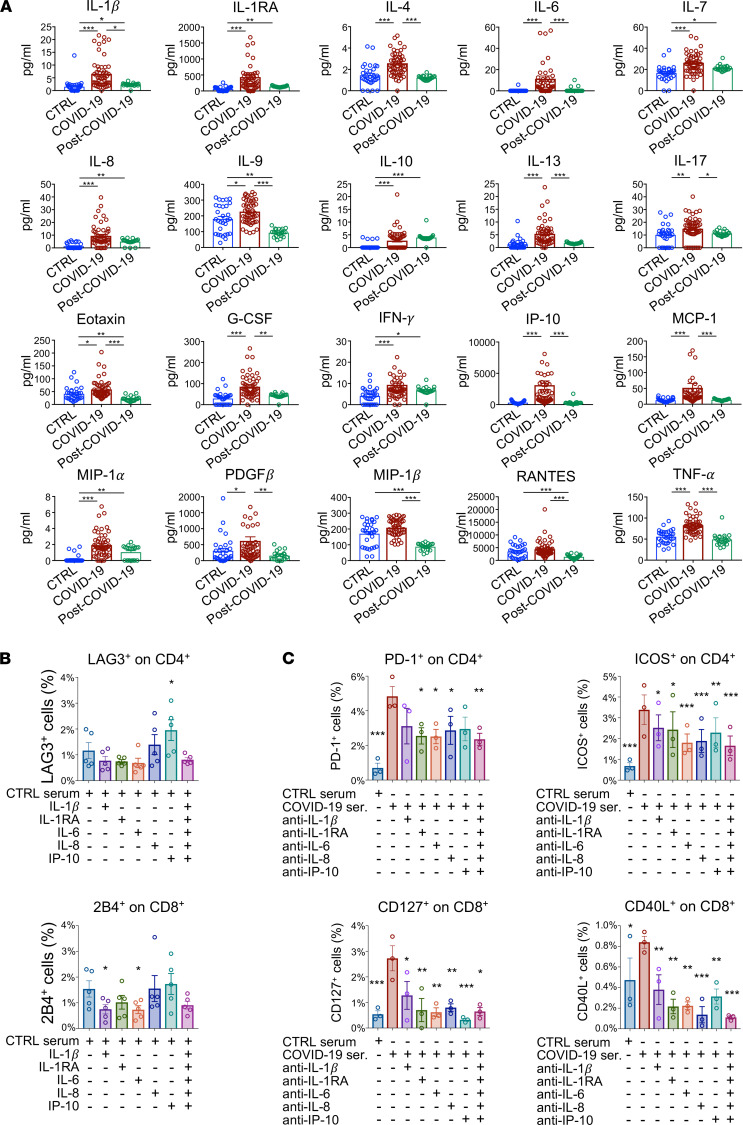
Figure 2. Cytokine profile and T cell exhaustion in patients who recovered from COVID-19 as compared with those with COVID-19 and with healthy controls.
(A) Bar graphs depicting cytokine serum levels assessed by Luminex-based technology in patients with COVID-19 (n = 50), in those who recovered from COVID-19 (n = 20), and in healthy controls (n = 30). (B) Bar graphs depicting the percentage of LAG3+ cells in the CD4+ T cell population and of 2B4+ cells in CD8+ T cells assessed by flow cytometric analysis in PBMCs of healthy controls (n = 5) that were treated ex vivo with selected proinflammatory cytokines, either individually or as a pool. (C) Bar graph depicting percentage of PD-1+ and ICOS+ CD4+ T cells and of CD127+ and CD40L+ CD8+ T cells as assessed by flow cytometric analysis of PBMCs isolated from patients with COVID-19 (n = 5) that were exposed ex vivo to medium containing serum of patients with COVID-19 in the presence of blocking antibodies directed against IL-1β, IL-1RA, IL-6, IL-8, or IP-10, added either individually or as a pool. Data are reported as mean ± SEM unless otherwise reported. *P < 0.05, **P < 0.01, ***P < 0.001 calculated with Kruskal-Wallis test (A) or 1-way ANOVA (B and C). CTRL, healthy controls; COVID-19, patients with COVID-19; post–COVID-19, patients who recovered from COVID-19.

