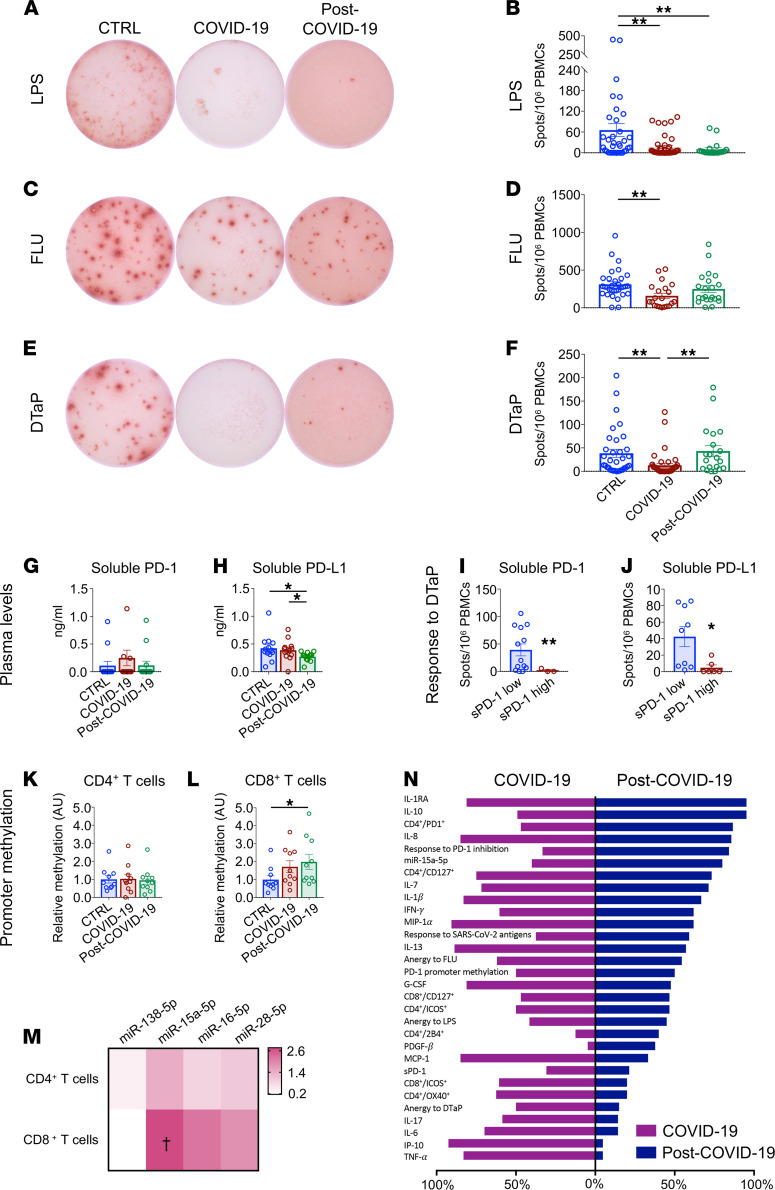
Figure 3. T cells from patients who recovered from COVID-19 are exhausted.
(A–F) Representative images and bar graphs of ELISpot analysis depicting IFN-γ spots produced by PBMCs isolated from patients with COVID-19 (n = 40), from those who recovered from COVID-19 (n = 20), and from healthy controls (n = 30) following challenge with LPS (A and B), FLU (C and D), and DTaP (E and F). (G and H). Bar graphs depicting soluble PD-1 and soluble PD-L1 plasma levels in patients with COVID-19 (n = 13), in those who recovered from COVID-19 (n = 13), and in healthy controls (n = 14). (I and J) Bar graphs depicting the immune T cell response upon DTaP stimulation in patients with COVID-19 with high (above the median) versus low (below the median) levels of soluble PD-1 (I) or PD-L1 (J). (K and L) Relative levels of PD-1 promoter DNA methylation in CD4+ (K) or CD8+ (L) T cells of patients with COVID-19 or after recovery as compared with healthy controls. (M) Heatmap showing color-coded relative levels of PD-1–targeting miR–138-5p, miR–15a-5p, miR–16-5p, and miR–28-5p miRNAs in CD4+ and CD8+ T cells of patients with COVID-19 and in those who recovered from COVID-19 (n = 10) normalized versus controls (n = 5). (N) Bar graph comparing the global immunological profiles of patients with COVID-19 after clinical symptom remission and during the acute phase of the disease. Each bar depicts the proportion of patients for which the value of the related factor is above the 75th percentile of the control group dataset. Data are expressed as mean ± SEM. *P < 0.05, **P < 0.01; †P < 0.05 as compared with healthy controls, calculated with Kruskal-Wallis test (B, D, F–H, K, and L) or 2-tailed unpaired t test (I, J, and M). CTRL, healthy controls; COVID-19, patients with COVID-19; post–COVID-19, patients who recovered from COVID-19; DTaP, diphtheria-tetanus-pertussis vaccine; FLU, flu vaccine; sPD-1, soluble PD-1; sPD-L1, soluble PD-L1; FC, fold change; A.U., arbitrary units.

