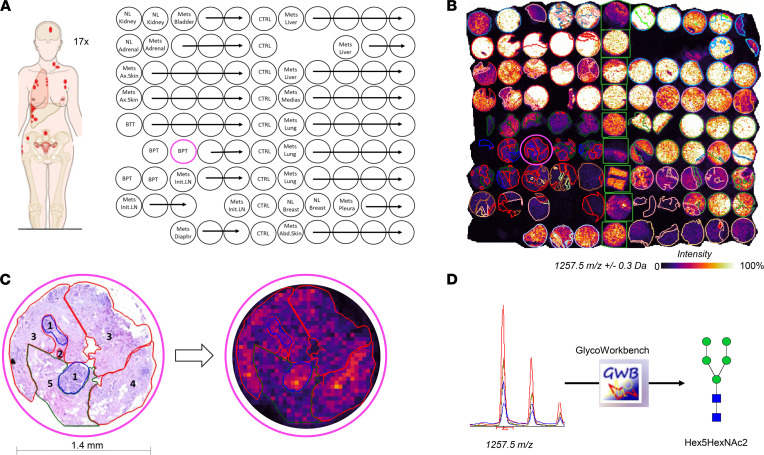
Figure 1. Overview of study design and analysis strategy.
(A) Schematic layout of TMA #12. Each of the 17 TMAs consisted of 99 cores, with 9 cores of control tissue and 4–5 cores per tumor. BPT, breast primary tumor; BTT, breast treated tumor; CTRL, control; Mets, metastasis; NL, normal; Ax, axilliary; Abd, Abdominal; LN, lymph node; Diaphr, diaphragm; Medias, mediastinum. Pink circle denotes the sample shown in C. (B) MALDI-MSI data of TMA #12 at a spatial resolution of 50 μm per pixel. The m/z 1257.5 map is overlaid with pathological annotations, demonstrating differential abundance between different annotated organ sites. (C) Detailed histological annotation of representative breast PT core (left) coregistered with MSI data (right): 1, normal tissue; 2, cancer; 3, cancer mixed with cancer-associated stroma; 4, cancer mixed with lymphoplasmacytic infiltrate; and 5, cancer-associated stroma. Blue lines are for normal, red for cancerous tissue, and green for stroma. (D) Identification of m/z values of interest from all 17 TMAs was performed using GlycoWorkbench 2.1 software with GlycomeDB database. In this example, m/z 1257.56 ± 0.3 Da was identified as Hex5HexNAc2.

