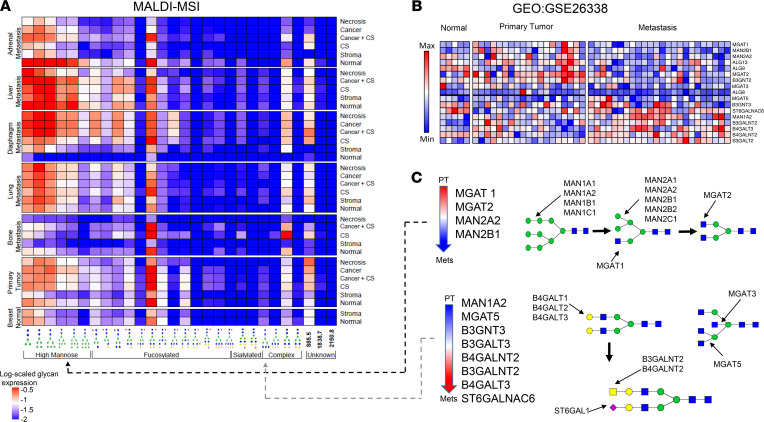
Figure 2. N-glycan abundances grouped by anatomical sites and histological tissue types.
(A) The heatmap represents an overview of the 28 significantly differentially abundant N-glycans throughout 7 most common organ sites and 6 most common pathology annotations. Each entry represents the average level of a given N-glycan across all 17 TMAs for a specific site and annotation combination. The glycans are grouped based on glycan structure similarities (bottom). MALDI-MSI data are displayed log-scaled. CS, cancer-associated stroma. Bone metastasis consists of pooled bone, spine, vertebra, and rib metastases. (B) Data set GEO GSE26338 analyzed for N-glycosylation genes. Heatmap showing significantly altered genes between PT and metastatic tumors (P < 0.05, FDR < 0.15). (C) Differentially expressed genes shown schematically within the N-glycan biosynthesis pathway. Dashed lines indicate consistent observations in GE and MSI analyses.

