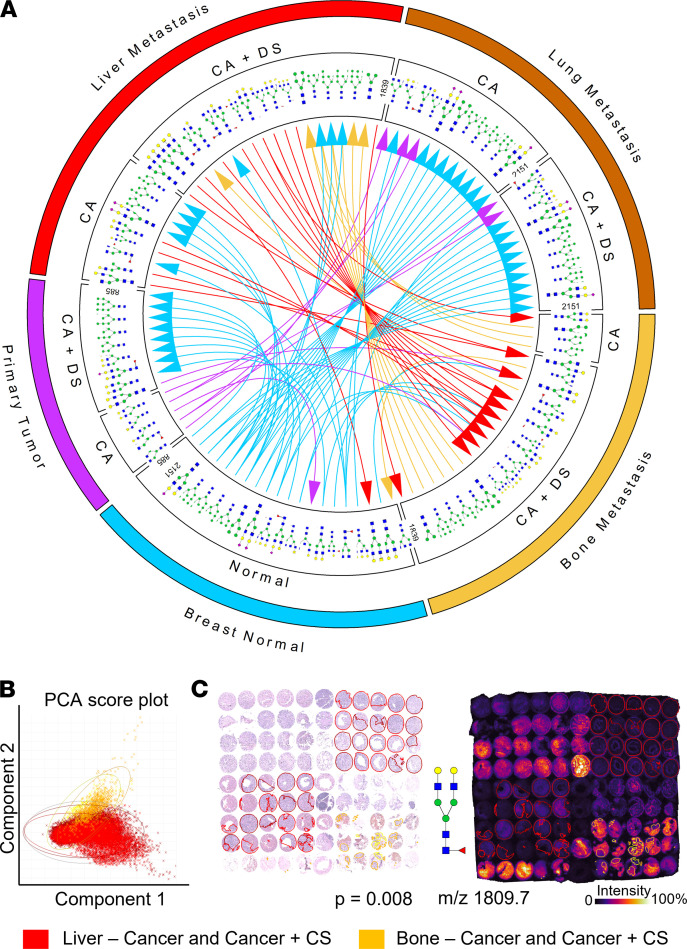
Figure 3. Summary of significantly differentially abundant N-glycans in distant metastatic sites and tissue-type annotations with a focus on bone and liver metastases.
(A) Comparisons of N-glycan abundance between normal breast and PT, and between the metastatic sites of bone, lung, and liver. The arrows indicate increases in abundance in the direction of the arrow, color-coded in the color of the tissue with lower N-glycan levels. CA, cancer; CA+CS, cancer with cancer-associated stroma. Bone metastasis consists of pooled bone, spine, vertebra, and rib metastases. (B) Principal component analysis of TMA #17 showing N-glycan bone (yellow) and liver (red) metastases differences. Score plot for all individual pixels belonging to annotations of CA or CA+CS. PC-1 and -2 show differentiation in N-glycan profile of these 2 metastatic sites. The oval lines indicate 95% CI. (C) (Left) H&E staining of TMA #17 metastases with annotations of CA or CA+CS in bone and liver metastases. (Right) MALDI-MSI visualization of one of the most significantly altered N-glycans Hex5dHex1HexNAc4, m/z 1809.7 for bone (yellow) or liver (red) metastases with annotations of CA or CA+CS.

