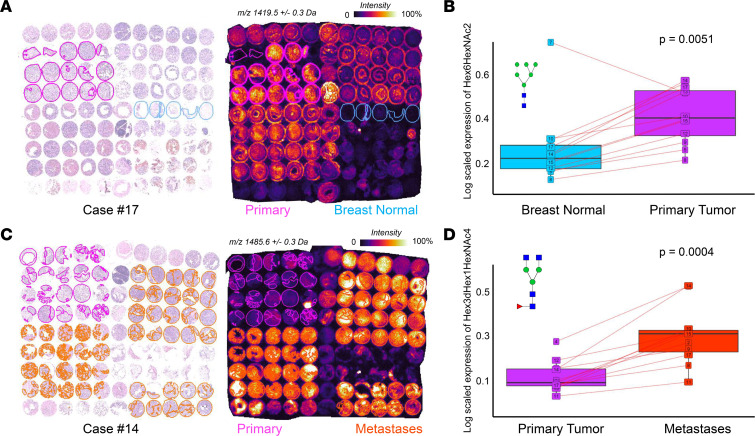
Figure 4. Increased abundance of 2 sample N-glycans from normal breast to PT to metastases.
(A and B) Hex6HexNAc2 was significantly increased in the PT (pink) compared with normal breast (blue) tissue in case #17 (A) and across the entire cohort (B, P = 0.005). (C and D) Hex3dHex1HexNAc4 was significantly increased compared with PT (pink) metastases (orange) in case #14 (C) and across the entire cohort (D, P = 0.0004). In A and C, the respective TMA is stained with H&E (left panels) and analyzed by MALDI-MSI (right panels). In B and D, individual lines show the respective N-glycan expressed in the same patient.

