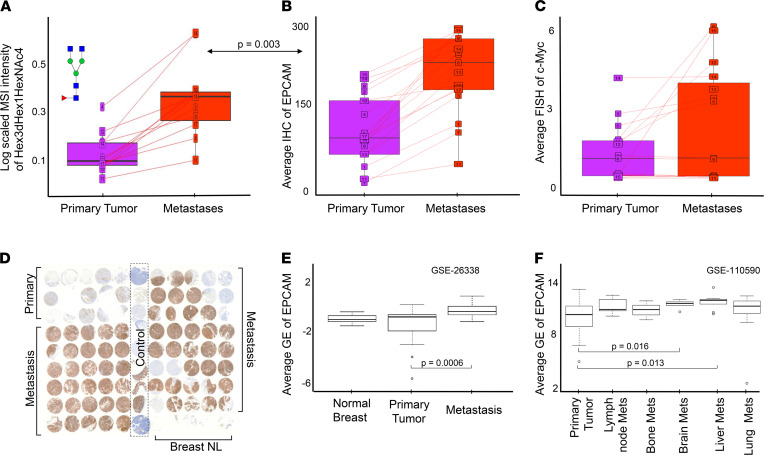
Figure 6. Expression of N-glycans by MSI correlated with EpCAM levels by IHC and GE in primary tumors (pink) and metastases (red) for the patient cohort.
(A) Abundance of MALDI-MSI of N-glycan Hex3dHex1HexNAc4; the arrow denotes corrected P value for correlation of Hex3dHex1HexNAc4 N-glycan levels with EpCAM. (B) IHC of EpCAM expression. (C) FISH of c-MYC gene amplification. For A–C, lines connect expression in PT and metastases for individual patients. (D) Anti-EpCAM staining of one exemplary TMA #9. (E) EpCAM GE expression between normal breast, PT, and metastasis. (F) EpCAM GE expression in PT and site-specific metastasis. For E and F, bars represent tested pairs and their P value.

