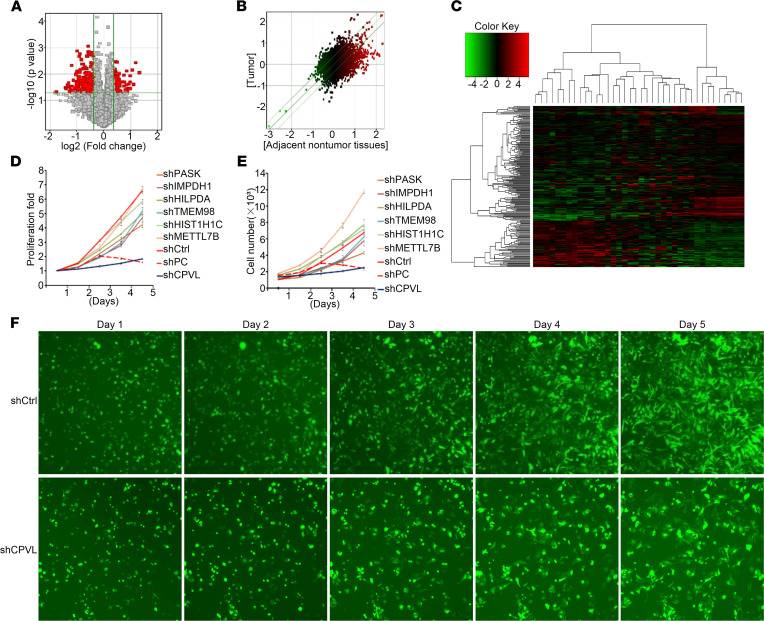
Figure 1. Gene expression profile analysis of CPVL in gliomas.
(A) Volcanic map of differentially expressed genes in 19 human glioma tissues and corresponding adjacent noncancerous tissues. Red dots are significantly differentially expressed genes, and gray dots are nonsignificantly differentially expressed genes. (B) Scatter plot of differentially expressed genes in 19 human glioma tissues and corresponding adjacent noncancerous tissues. The parallel green solid line is the difference reference line, and the points within the reference line represent the probe group with no significant change. Red points outside the reference line represent the probe group with relatively upregulated expression in the glioma tissues group, and green points represent the probe group with relatively upregulated expression in the adjacent noncancerous tissues group. (C) Clustering analysis of differentially expressed genes in 19 human glioma tissues and corresponding adjacent noncancerous tissues. Red indicates that the gene expression level is relatively upregulated, green indicates that the gene expression level is relatively downregulated, black indicates that there is no significant change in the gene expression, and gray indicates that the signal intensity of the gene is not detected. (D–F) The effect of CPVL inhibition on cell proliferation was detected by high-content screening (HCS). The data are shown as mean ± SD. Total original magnification, 200×.

