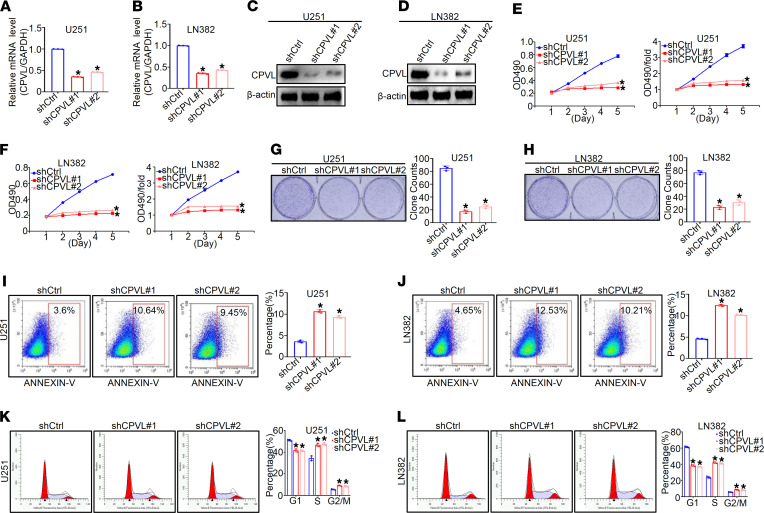
Figure 3. CPVL silencing inhibits the proliferation, promotes apoptosis, and regulates cell cycle of glioma cells in vitro.
(A and B) Relative CPVL mRNA expression in U251 and LN382 cells expressing CPVL shRNA#1 and CPVL shRNA#2 determined by real-time PCR (n = 3). (C and D) Western blotting analysis of CPVL expression in CPVL-silenced U251 and CPVL-silenced LN382 cells (n = 3). (E and F) MTT assays were used to investigate the cell proliferation rates in CPVL-silenced U251 and CPVL-silenced LN382 cells (n = 3). (G and H) Colony formation assay was used to investigate the cell proliferation capacity of the CPVL-silenced U251 and CPVL-silenced LN382 cells. Representative pictures are shown on the left, and the number of colonies counted are shown on the right (n = 3). (I and J) FACS assay was used to detect the effect of cell apoptosis in CPVL-silenced U251 and CPVL-silenced LN382 cells (n = 3). Representative profiles are shown on the left, and the percentages of cells that were statistically analyzed are shown on the right. (K and L) Cell cycle assays were used to investigate the influence of CPVL silencing on cell cycle in CPVL-silenced U251 and CPVL-silenced LN382 cells (n = 3). The fractions of viable cells in the G1, S, and G2-M phases were quantified by flow cytometry. Representative profiles are shown on the left, and the percentages of cells that were statistically analyzed are shown on the right. All experiments were repeated 3 times. β-Actin was used as a loading control. Bar graph data are presented as mean ± SD. One-way ANOVA with Dunnett’s multiple comparisons test analyses were performed. *P < 0.05.

