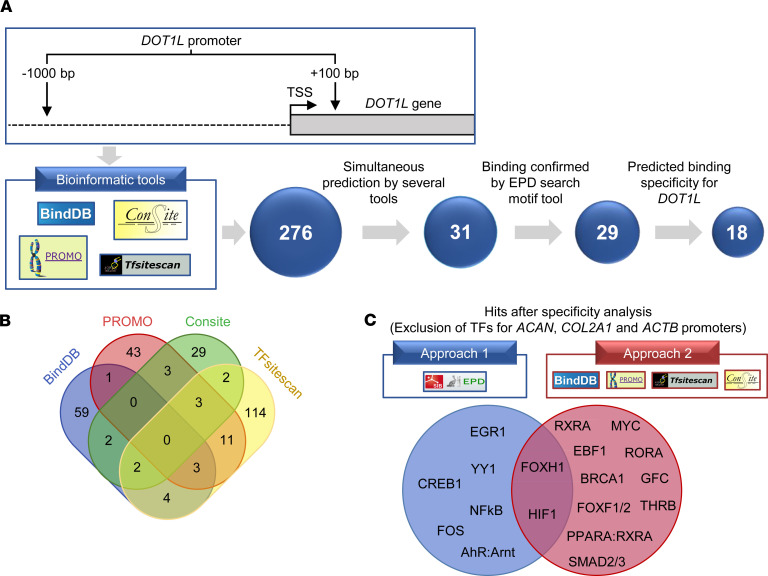
Figure 1. Bioinformatics pipeline identifies transcription factors regulating the DOT1L gene.
(A) Overview of the bioinformatics analysis flow of the human DOT1L proximal promoter. The top part of A displays the DOT1L gene promoter region that was used for the analysis, namely –1000 bp to +100 bp relative to the transcription start site (TSS). The bottom part shows the 4 different bioinformatics web-based tools that were used and the transcription factor (TF) selection pipeline. (B) Venn diagram of the 276 TFs found by the 4 different tools, of which the TFs predicted by at least 2 different tools were selected for further analysis. (C) Overview of hits remaining after the specificity analysis. Two different approaches were used to determine whether the TFs were more specific for the DOT1L promoter compared with the aggrecan (ACAN), collagen 2a1 (COL2A1), and actin (ACTB) promoters. The diagram shows the 18 resulting TFs predicted to be more specific for DOT1L after exclusion of TFs by approach 1 or 2 as well as their overlap.

