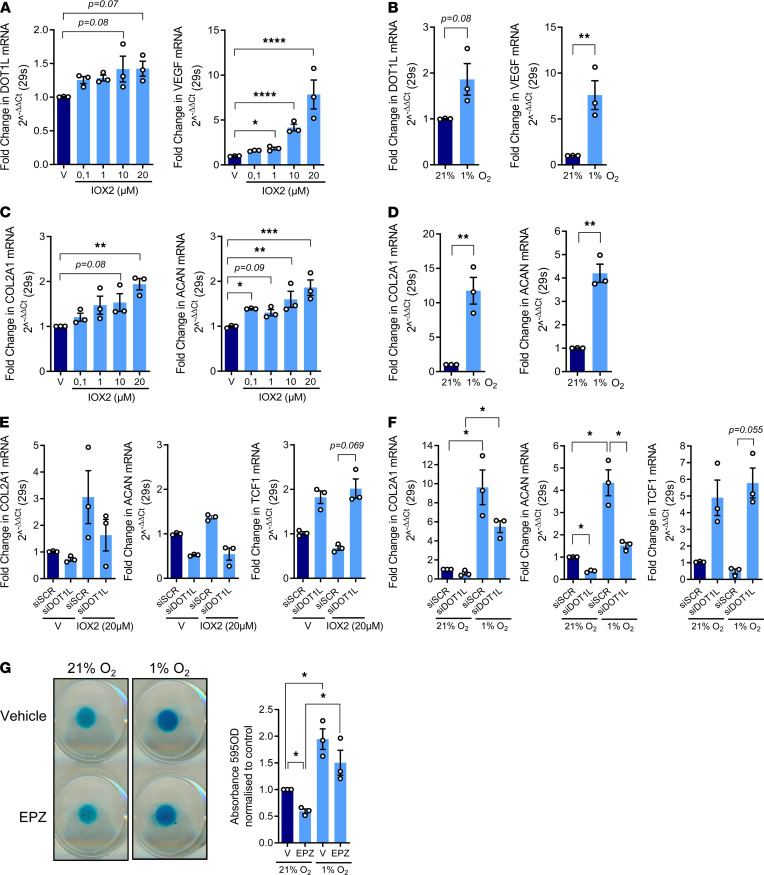
Figure 5. DOT1L contributes to the protective effects of hypoxia in human articular chondrocytes.
(A) Real-time PCR analysis of DOT1L and VEGF in primary human articular chondrocytes (hACs) after treatment with hypoxia mimetic IOX2 or vehicle (V) at the indicated concentrations for 72 hours (n = 3, *P < 0.05, ****P < 0.0001, Holm corrected for 10 tests by generalized least squares model). (B) Real-time PCR analysis of DOT1L and VEGF in primary hACs cultured in normoxic (21% O2) or hypoxic (1% O2) conditions for 14 days (n = 3, **P < 0.01 by paired t test). (C) Real-time PCR analysis of COL2A1 and ACAN in primary hACs after treatment with IOX2 at the indicated concentrations or V for 72 hours (n = 3, *P < 0.05, **P < 0.01, ****P < 0.0001, Holm corrected for 10 tests by generalized least squares model). (D) Real-time PCR analysis of COL2A1 and ACAN in primary hACs cultured in normoxic (21%O2) or hypoxic (1%O2) conditions for 14 days (n = 3, **P < 0.01 by paired t test). (E) Real-time PCR analysis of COL2A1, ACAN, and TCF1 in primary hACs after treatment with hypoxia mimetic IOX2 (20 μM) or V and siRNA-mediated silencing of DOT1L (siDOT1L) or scrambled control (siSCR) for 72 hours (n = 3, P < 0.05, Šidák corrected for 6 tests in 2-way ANOVA). (F) Real-time PCR analysis of COL2A1, ACAN, and TCF1 in primary hACs cultured in normoxic (21%O2) or hypoxic (1%O2) conditions for 14 days and siRNA-mediated silencing of DOT1L or siSCR (n = 3, *P < 0.05, Šidák corrected for 6 tests in 2-way ANOVA). (G) Alcian blue staining of primary hAC micromasses cultured in normoxic (21%O2) or hypoxic (1%O2) conditions treated with V or DOT1L inhibitor EPZ-5676 (EPZ) for 14 days. Images are representative of 3 independent experiments with technical triplicates. Quantification of staining relative to V in normoxic conditions was determined by colorimetry at 595 nm (n = 3, *P < 0.05 Šidák corrected for 6 tests in 2-way ANOVA). Data are shown as the mean ± SEM.

