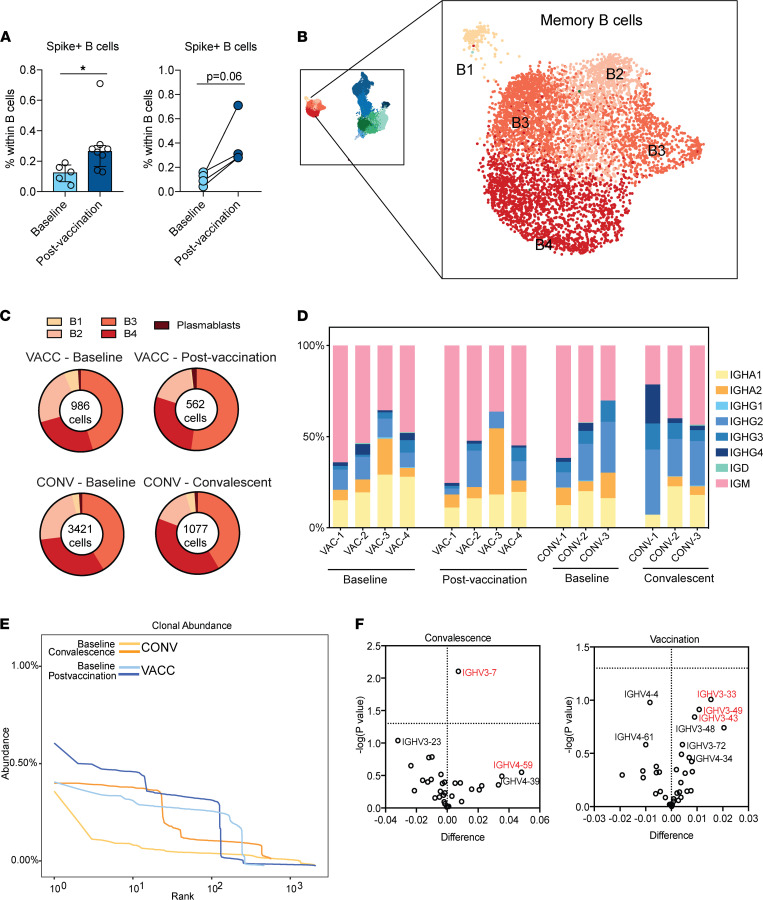
Figure 2. B cell adaptations following SARS-CoV-2 mRNA vaccination and infection.
(A) Dot plots representing expansion of spike+ cells within total CD20+ B cells in PBMCs before and after vaccination (aggregate differences at baseline, n = 5, and following vaccination, n = 8, on the left; matched differences on the right, n = 4). PBMCs were incubated with biotinylated spike protein and fluorochrome-conjugated streptavidin, surface stained, washed, and analyzed using flow cytometry. Group differences were tested using unpaired t test with Welch’s correction (left) or paired t test (right). Error bars denote medians and interquartile ranges. (B) Magnified image of B cell subsets identified using scRNA-Seq. Data include samples from all 4 groups. (C) Pie chart quantifying B cell cluster frequencies after infection and vaccination. (D) Isotype distribution of productive B cell clones in vaccinated (n = 4) and convalescent (n = 3) individuals. Isotypes were determined based on the constant region of the clone. (E) Aggregate clonal abundance following vaccination and infection. (F) Volcano plots depicting heavy chain gene usage biases following convalescence (relative to preinfection baseline) or vaccination (relative to prevaccination baseline). The x axis represents the change in gene usage, and the y axis represents P value (–log10). *P < 0.05.

