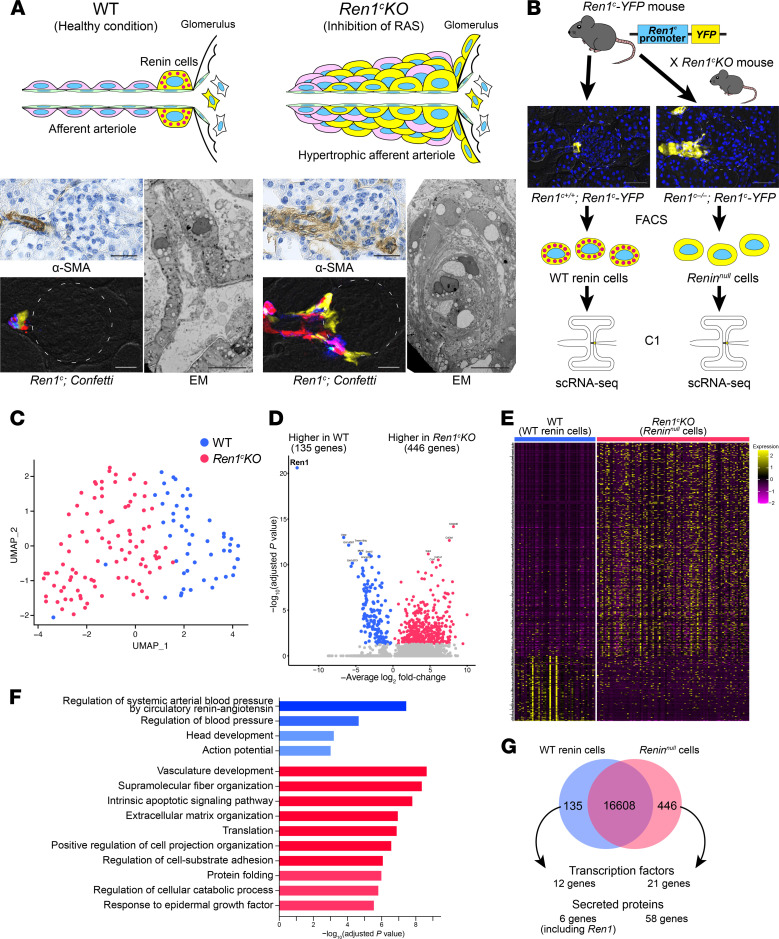
Figure 1. Reninnull cells have different transcriptomic profiles.
(A) Pathological findings of Ren1c-KO mice. Immunohistochemistry for α-SMA showed hypertrophic arterioles in Ren1c-KO mouse kidneys. Scale bars: 20 μm. Kidney sections from Ren1c-KO Ren1c-Cre Confetti mice showed multiple colors in the hypertrophic arterioles, suggesting the multiclonality of Reninnull cells. Scale bars: 20 μm. Left: WT mice showed normal architecture of periglomerular arterioles with a single layer of smooth muscle cells (SMCs). Right: Ren1c-KO mice showed concentric hypertrophy of arteriolar smooth muscle. Scale bars: 10 μm. (B) Schematic of scRNA-Seq of WT renin cells and Reninnull cells. Ren1c-YFP mice have a transgene consisting of the YFP genes driven by the Ren1c gene regulatory region. YFP-positive kidney cells from Ren1c+/+ Ren1c-YFP mice and Ren1c–/– Ren1c-YFP mice were isolated by FACS. Single cells were captured with the Fluidigm C1 System, and scRNA-Seq was performed. Scale bars: 50 μm. (C) The UMAP with all the cells after normalization. (D) Volcano plot showing the differentially expressed genes between WT renin cells and Reninnull cells. (E) Heatmap analysis with differentially expressed genes showed a clear separation of WT renin cells and Reninnull cells. (F) The 10 most enriched categories identified by GO analysis on genes higher in WT renin cells (red) and genes higher in Reninnull cells (blue). (G) Venn diagram showing differentially expressed genes. α-SMA, α–smooth muscle actin; EM, electron microscopy; FACS, fluorescence-activated cell sorting; GO, Gene Ontology; Ren1c-KO, Ren1c gene knockout; scRNA-Seq, single-cell RNA sequencing; UMAP, uniform manifold approximation and projection; WT, wild-type.

