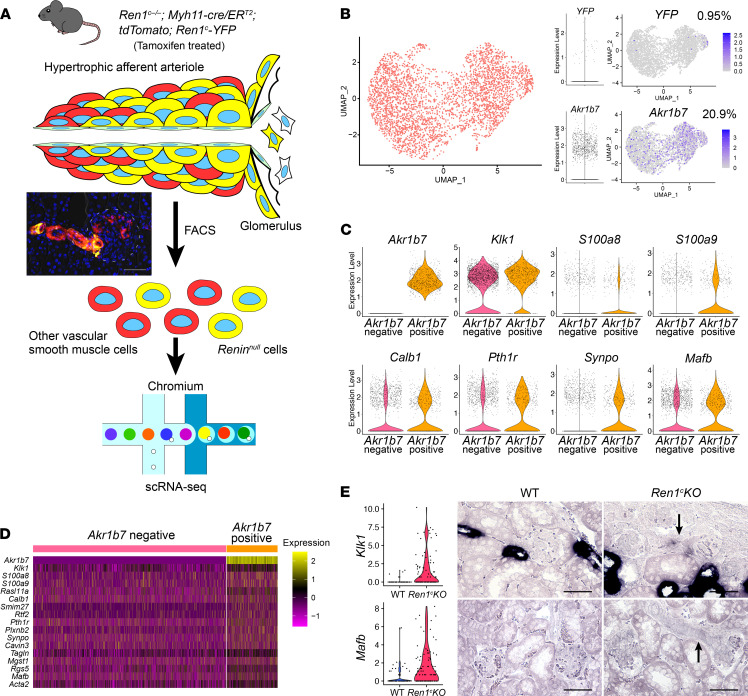
Figure 4. Reninnull mural cells comprise 2 phenotypically different groups of cells.
(A) Schematic of scRNA-Seq of Reninnull cells and other vascular SMCs. Fluorescent cells from Ren1c–/– Myh11-CreERT2 tdTomato Ren1c-YFP mouse kidneys were isolated by FACS. scRNA-Seq was performed with the 10x Genomics Chromium System. (B) The UMAP with all the cells after normalization and volcano plots and feature plots for YFP and Akr1b7. Respectively, 0.95% and 20.9% of the cells were positive for YFP and Akr1b7. (C) Violin plots of representative DEGs between Akr1b7-negative cells and Akr1b7-positive cells. (D) Heatmap analysis with DEGs between Akr1b7-negative cells and Akr1b7-positive cells. (E) Violin plots from C1 scRNA-Seq and ISH for Klk1 and Mafb mRNA in WT and the Ren1c-KO kidneys. Arrows indicate hypertrophic afferent arterioles. Scale bars: 50 μm. DEGs, differentially expressed genes; FACS, fluorescence-activated cell sorting; GO, Gene Ontology; ISH, in situ hybridization; Mafb, v-maf musculoaponeurotic fibrosarcoma oncogene family, protein B; Ren1c-KO, Ren1c gene knockout; scRNA-Seq, single-cell RNA sequencing; SMCs, smooth muscle cells; UMAP, uniform manifold approximation and projection; WT, wild-type.

