
Fig. 3.
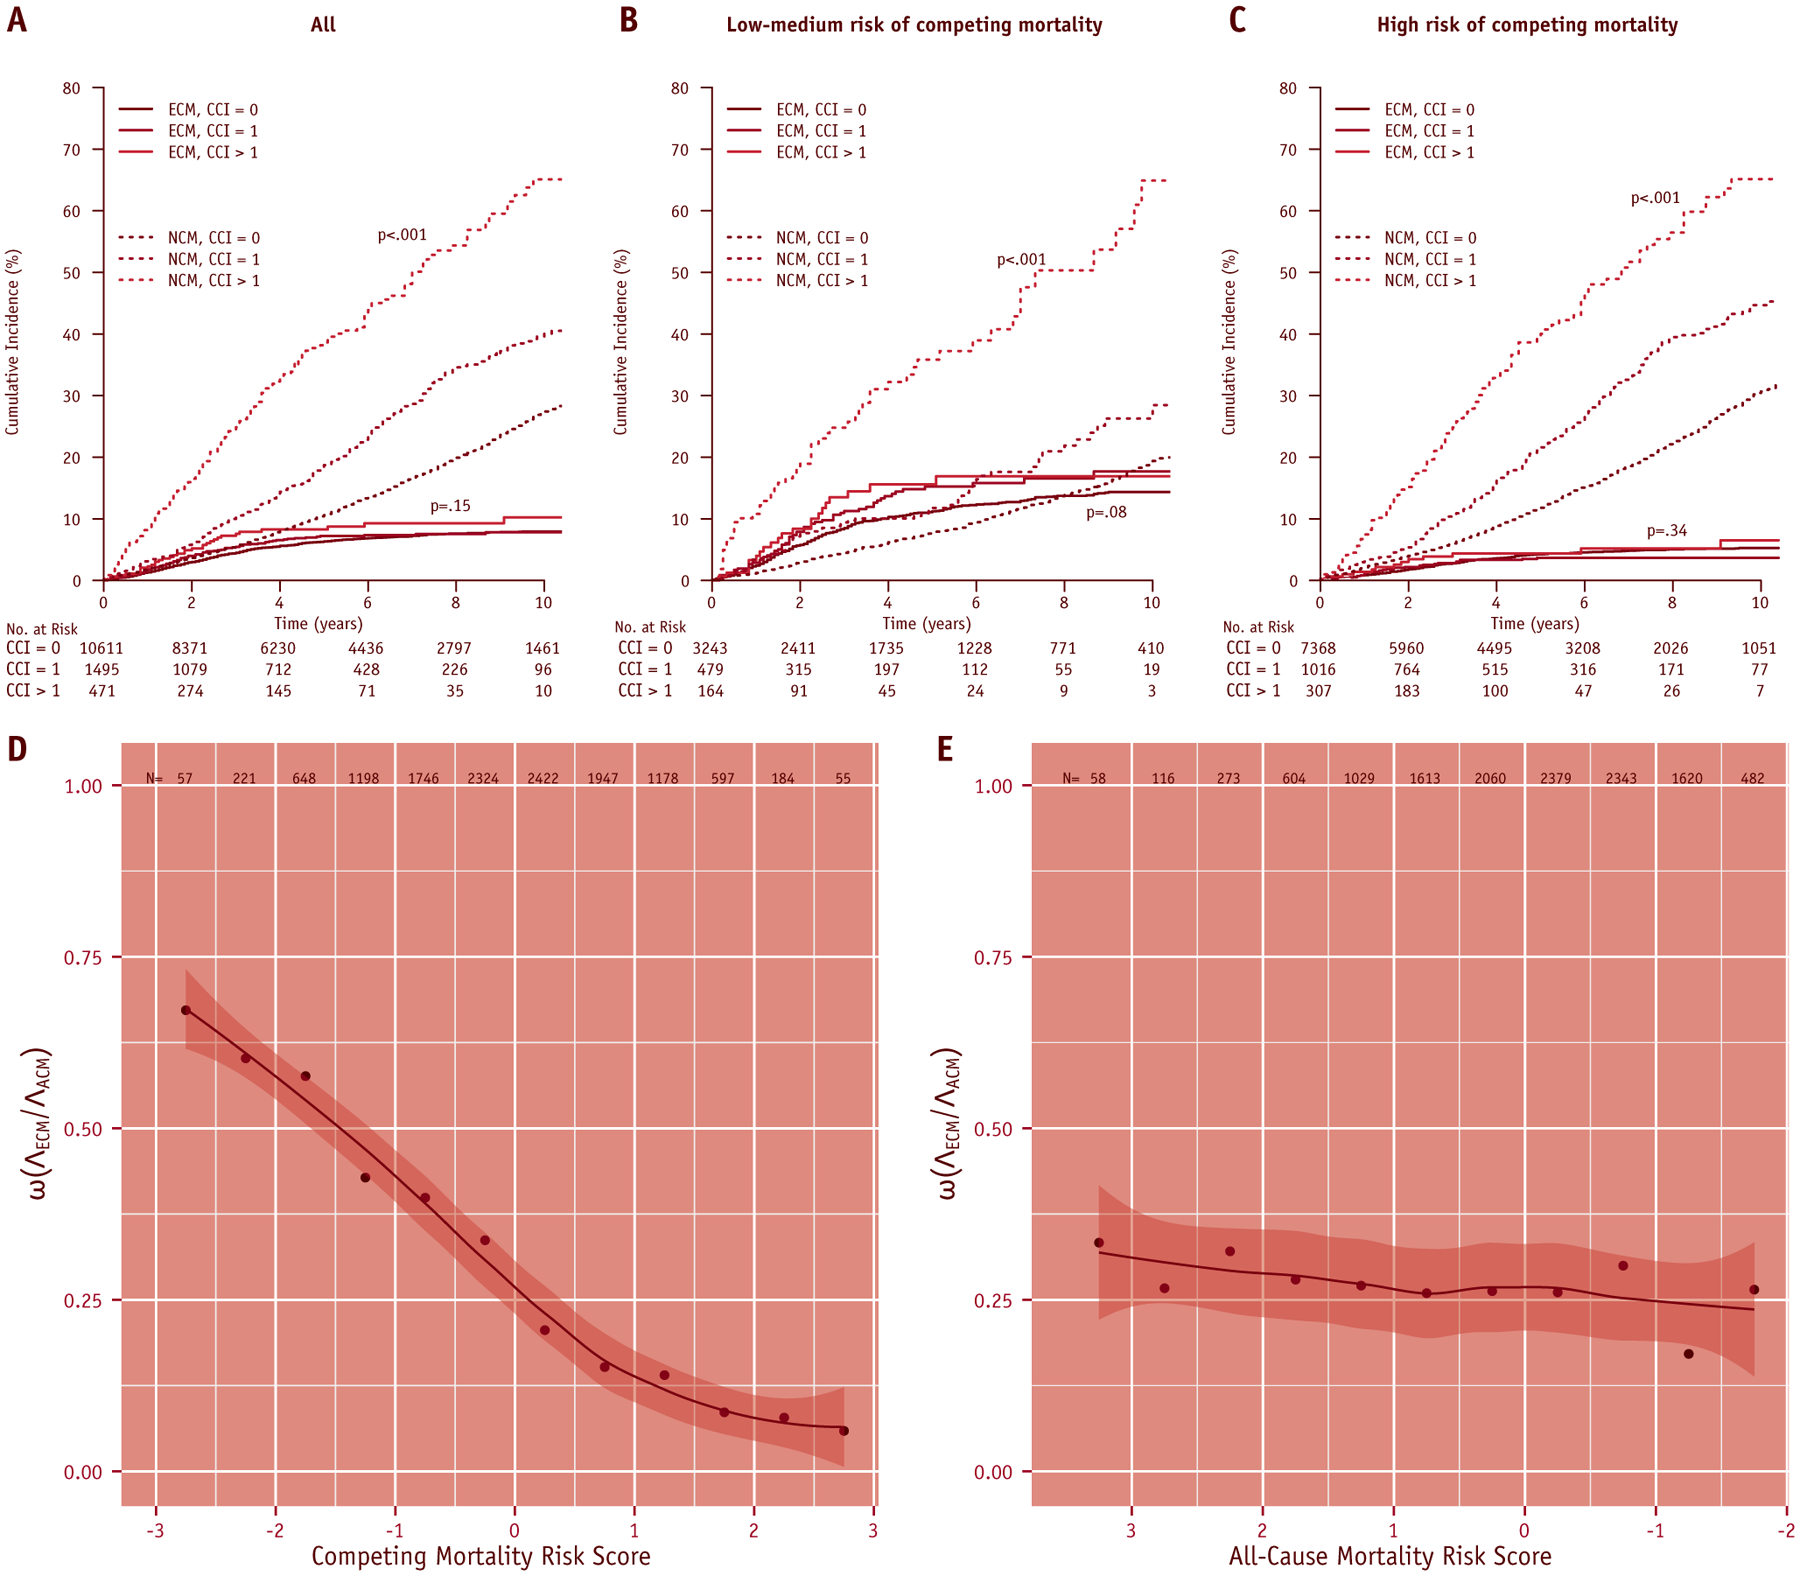
(A-C) Cumulative incidence plots with Gray’s test P values for endometrial cancer mortality (ECM) and noncancer mortality (NCM) grouped by the Charlson Comorbidity Index score according to all women in the (A) SEER-Medicare cohort and within (B) low-medium and (C) high competing mortality risk strata based on SEER-trained cutoffs. Gray’s test P values are shown. (D, E) Ratio (ω) of the cumulative hazard of endometrial cancer mortality (ΛECM) to all-cause mortality (ΛACM) at 5 years, as a (smoothed) function of (A) normalized competing event risk score or (B) normalized all-cause mortality risk score. Values of ω are calculated at intervals of one-half standard deviation of the risk score. The competing mortality risk score is better able to stratify patients based on event composition. The abscissa for all-cause mortality risk score is reversed, so that the likelihood of benefitting from treatment intensification decreases moving from left to right in both plots. CCI = Charlson Comorbidity Index; ECM = endometrial cancer mortality; NCM = noncancer morbidity; SCM = second cancer mortality.