Figure 2.

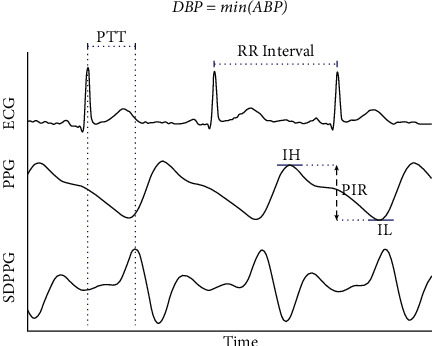
Computation of the ratio of photoplethysmogram (PPG) intensity (PIR) and pulse transit time (PTT). Here, IH refers to the PPG peak intensity, SDPPG the second derivative of PPG, and finally IL the valley intensity.

Computation of the ratio of photoplethysmogram (PPG) intensity (PIR) and pulse transit time (PTT). Here, IH refers to the PPG peak intensity, SDPPG the second derivative of PPG, and finally IL the valley intensity.