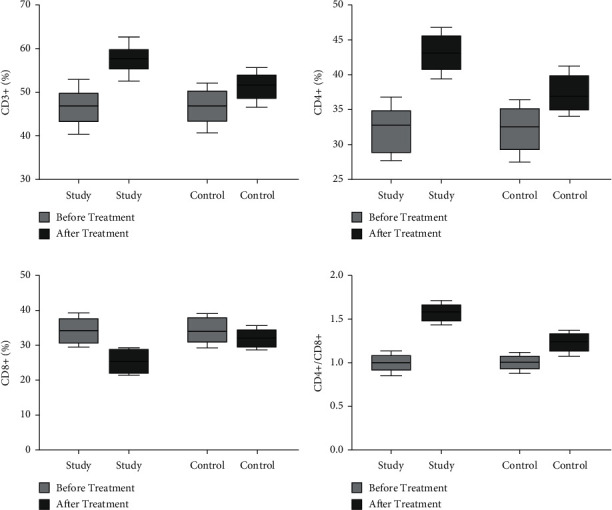
Figure 2.

Comparison of the immune function of the two groups of patients before and after treatment. (a) The comparison of the CD3+ levels of the two groups of patients before and after treatment. (b) The comparison of the CD4+ levels of the two groups of patients before and after treatment. (c) The comparison of the CD8+ levels of the two groups of patients before and after treatment. (d) The comparison of CD4+/CD8+ levels before and after treatment in the two groups.
