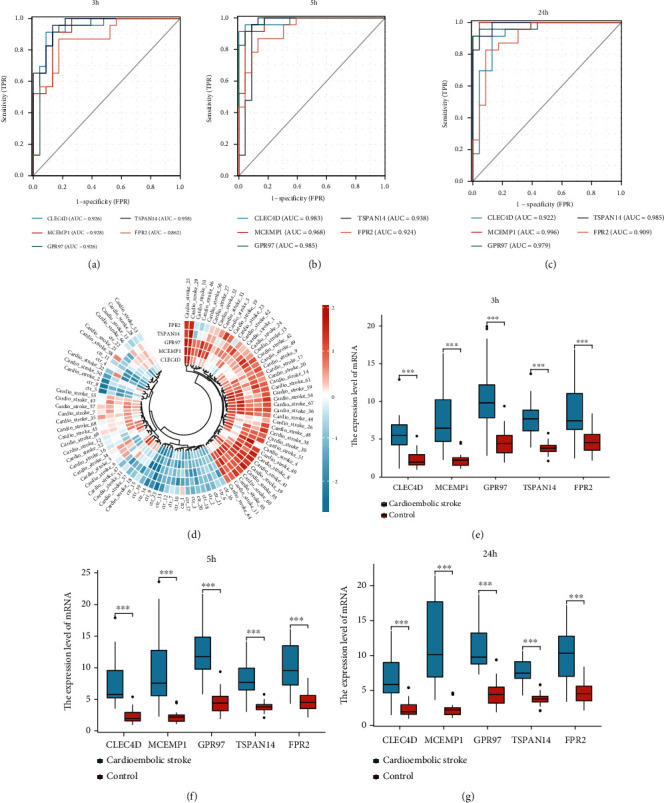
Figure 10.

The potential clinical values and expression level of five key genes. (a-c) Applying ROC analysis of 5 key genes to discriminate between cardioembolic stroke and control group, (a) 3 hours, (b) 5 hours, and (c) 24 hours following cardioembolic stroke. (d) Annular heatmap showing the expression of hub genes in each sample. (e–g) Box plots displaying changes in expression levels of CLEC4D, MCEMP1, GPR97, TSPAN14, and FPR2 in 3 h, 5 h, and 24 h after cardioembolic stroke. All crucial genes were significantly increased in patients with cardioembolic stroke compared to normal individuals.
